
Most charting tools show you price. Most AI tools answer questions. Kimpton now does both at the same time.
This update introduces a dedicated chart workspace where you can watch price action, track a watchlist, overlay technical indicators, and ask Kimpton questions about what you are seeing — all without leaving the page.
What's New
- Chart workspace with candlestick charts, watchlist, and technical indicators
- AI research sidebar built into the charting experience
- Ticker search across equities, crypto, futures, and commodities
- Chart preferences that persist across sessions
Why This Matters
Charting and research have always been separate workflows. You see a move on a chart, switch to a browser tab, search for context, then switch back. By the time you find the answer, you have lost the thread.
The chart workspace eliminates that loop. See a red candle, ask "What's driving this sell-off?" and get the answer in seconds — right next to the chart. Your research stays connected to the price action that prompted it.
Chart Workspace
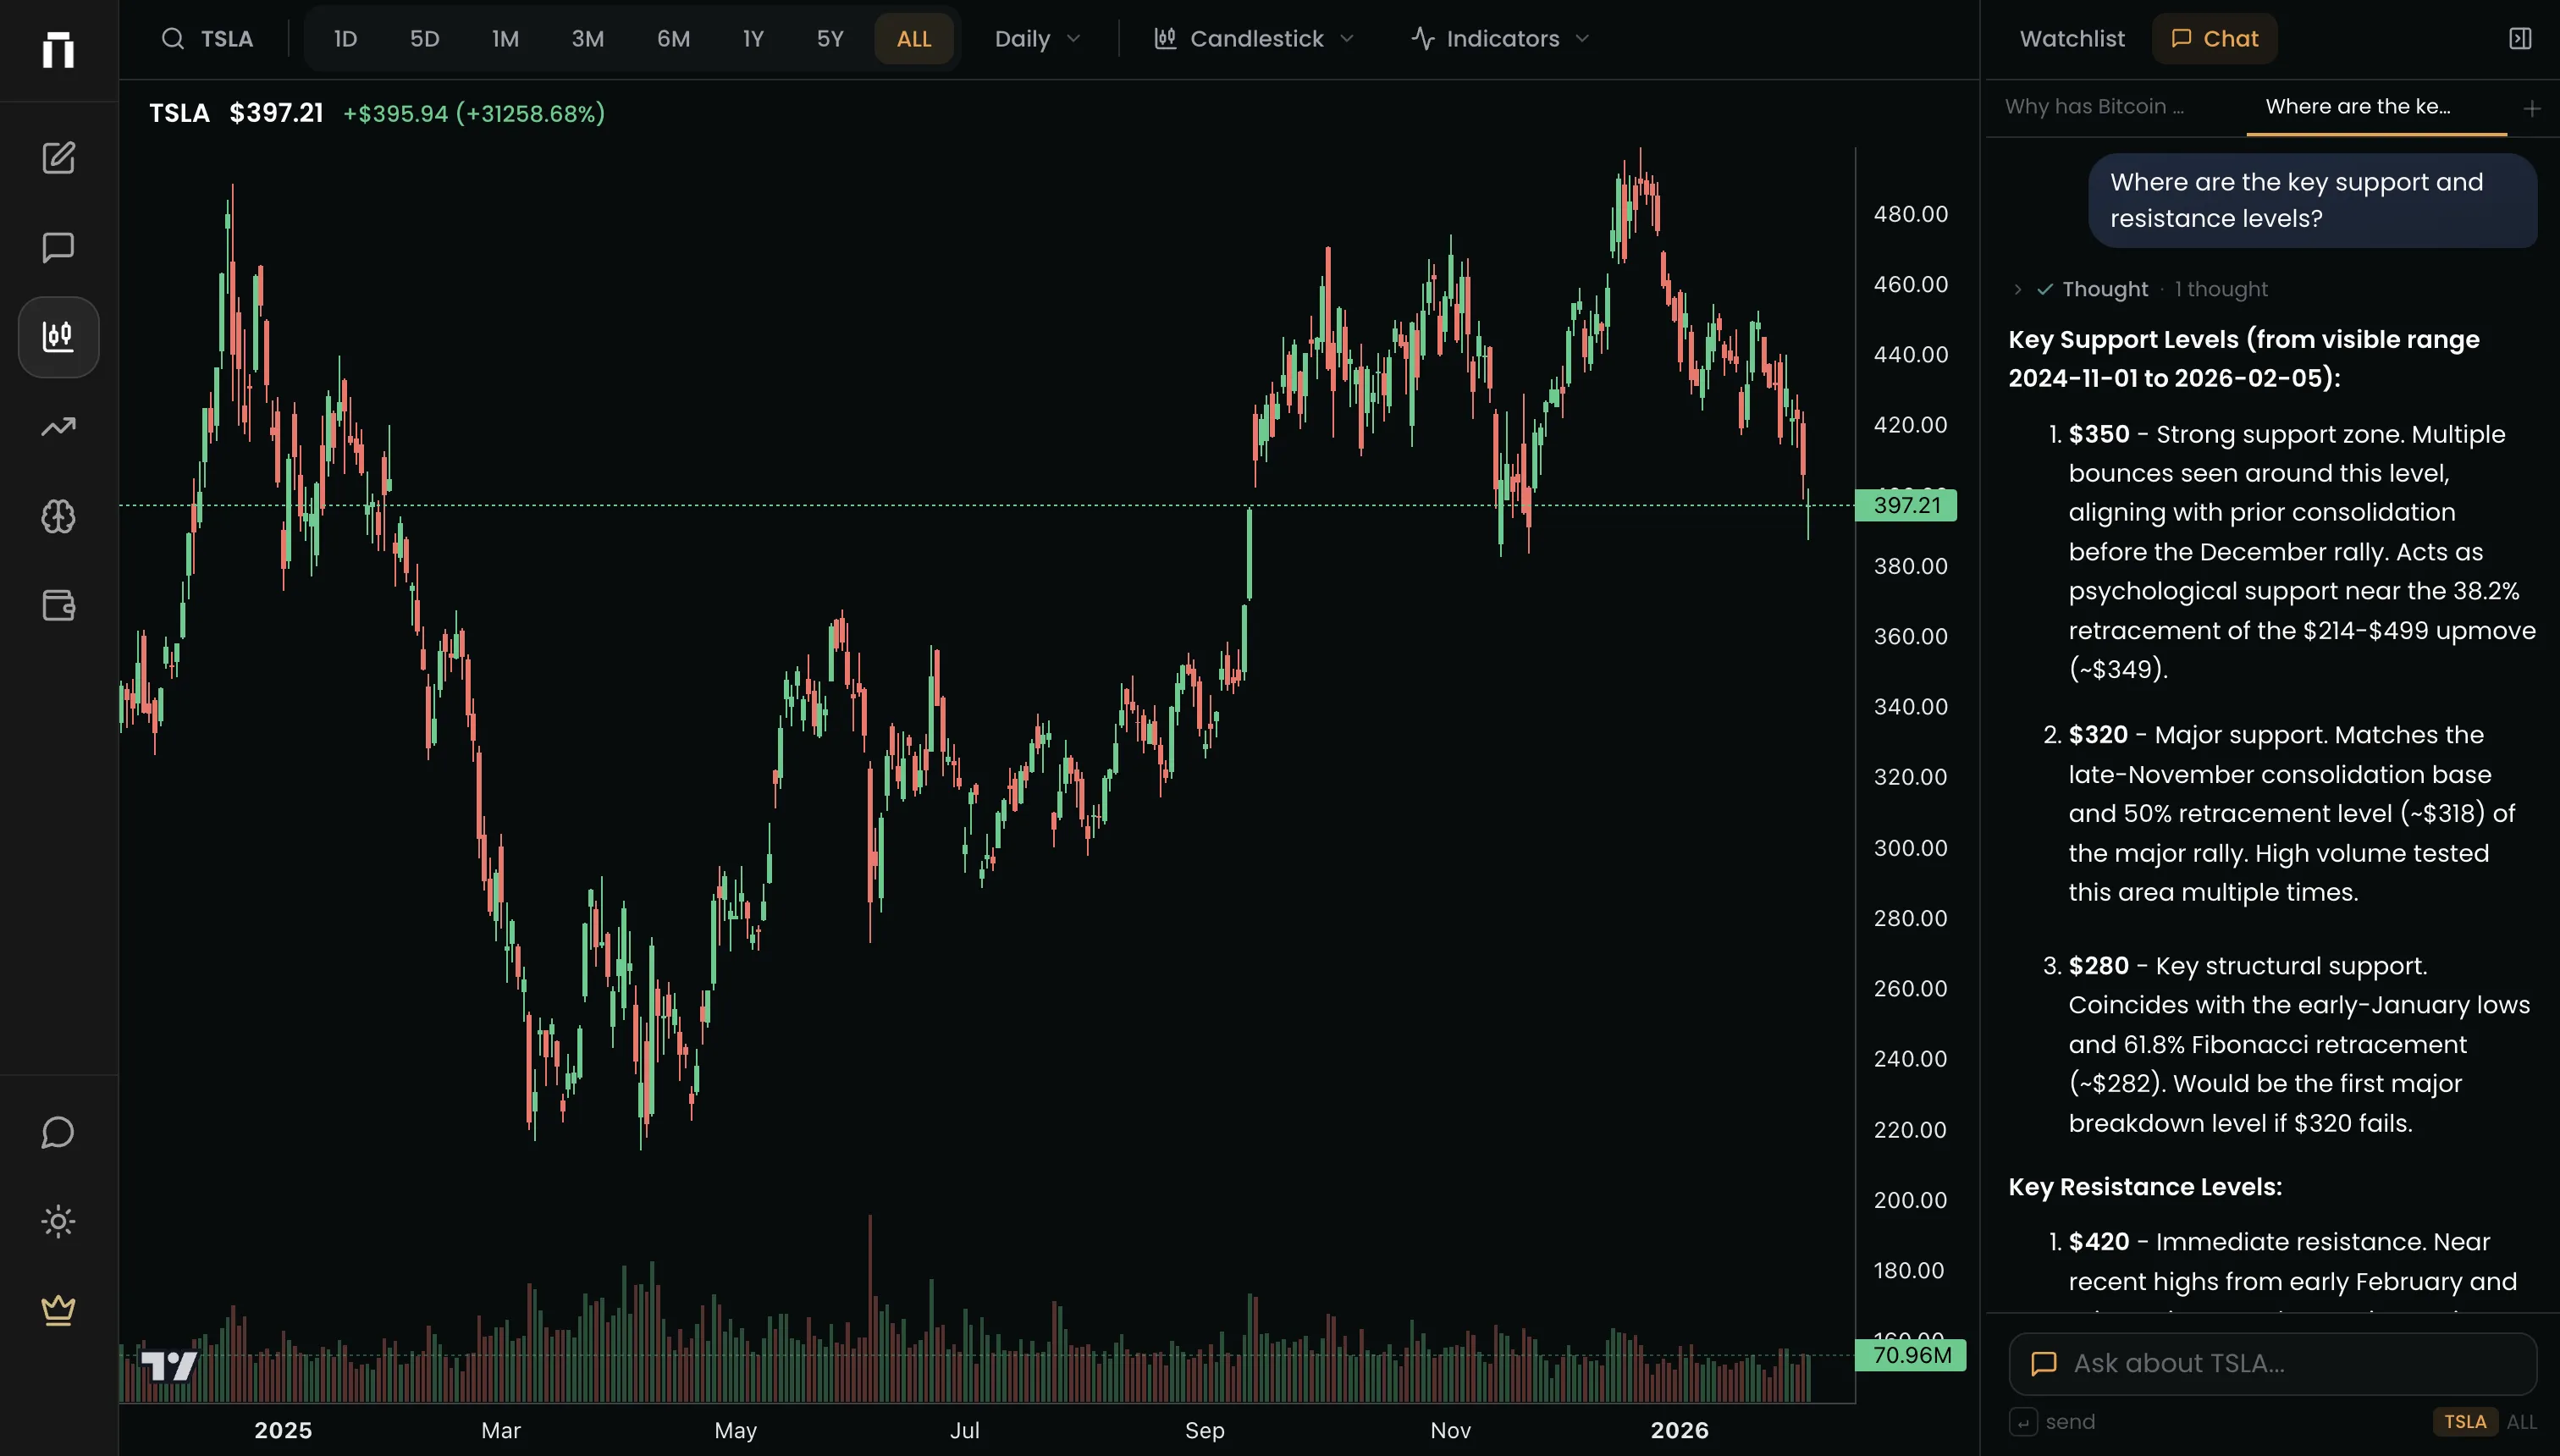
The new Charts page is a full charting environment built for research. Candlestick, line, and area charts with clean historical data across equities, crypto, futures, and commodities.
- Candlestick, line, and area chart types
- Technical indicators: SMA 20, SMA 50, SMA 200, EMA 12, EMA 26
- Timeframe selector: 1D, 5D, 1M, 3M, 6M, 1Y, 5Y, ALL
- Watchlist with live price updates
- Ticker search across all asset types
- Chart preferences saved automatically
The workspace is designed to feel like a trading terminal, not a research tool bolted onto a chart. Dark mode uses a neutral terminal-style palette. Charts stay mounted when you switch timeframes so there is no flash or reload. Everything loads fast.
AI Research Sidebar
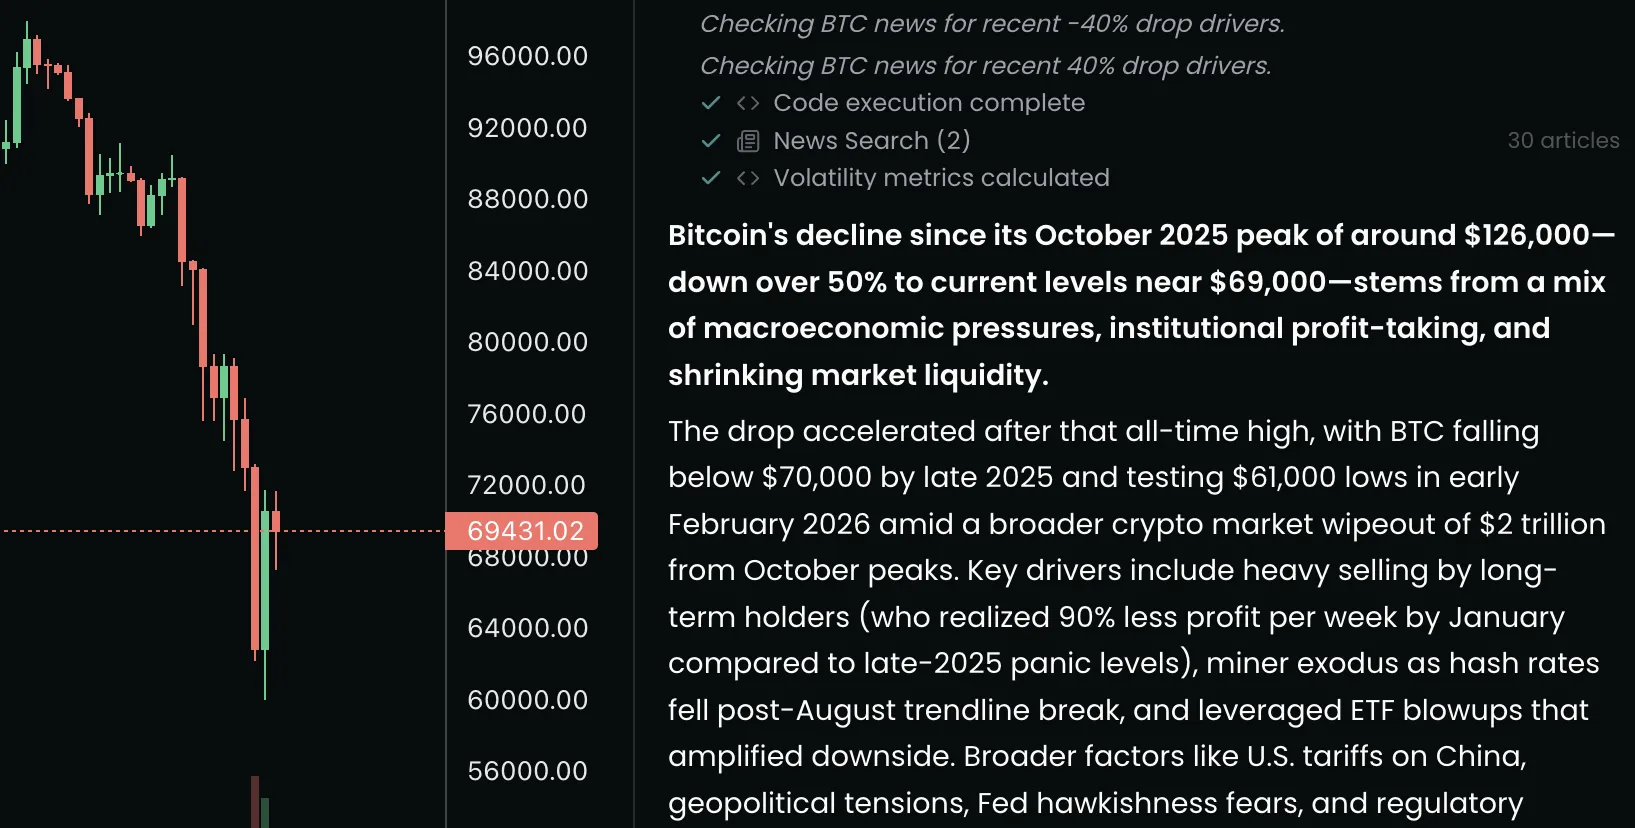
The right side of the chart workspace is a conversational AI panel. Ask any question about the ticker you are viewing and Kimpton researches it in real time. You can see each step — data fetches, news searches, reasoning — as it works through your question.
- Ask questions about any chart you are viewing
- Watch reasoning unfold step by step with a streaming typewriter
- Tool steps show what data Kimpton is pulling and analyzing
- Responses stay attached to the chart context
This is not a chatbot pasted next to a chart. The AI panel knows what ticker you are looking at, what timeframe you have selected, and what the recent price action looks like. When you ask "Why did this drop?", it already has the context.
Try asking
- “What's driving this sell-off?”
- “What news is driving this move today?”
- “How does this compare to the last earnings reaction?”
- “What is the correlation between this and gold over the past year?”
UI Improvements
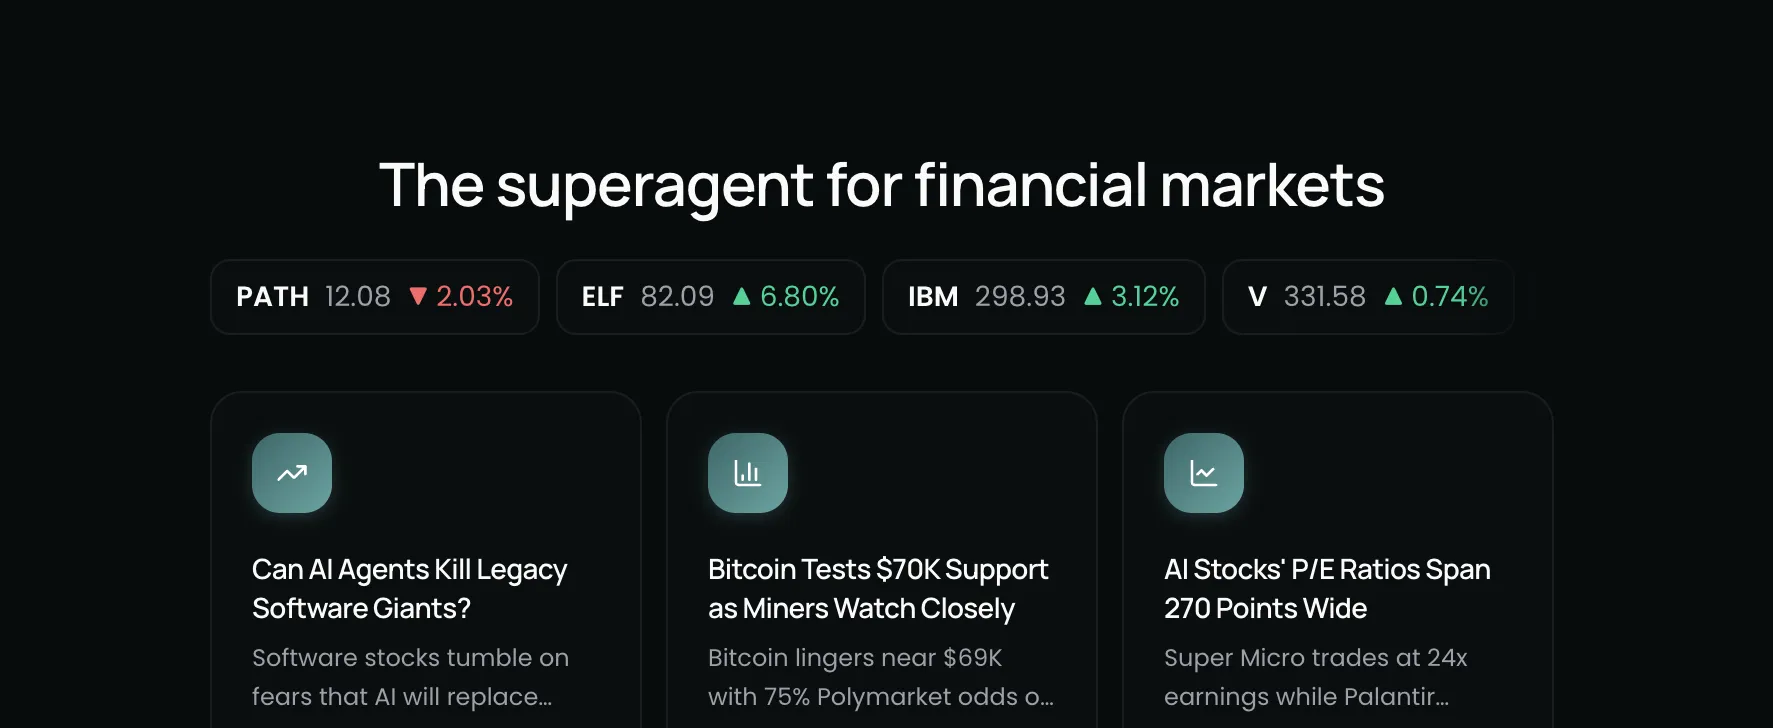
- Redesigned landing page with a cleaner layout and direct links to Market Insights and Charts
- Trending ticker pills on the landing page navigate straight to the chart workspace
- Improved mobile experience with a pinned input bar and simplified layout optimized for touch
- Dark and light theme consistency across every page
- Market Insights cards updated with unified styling
Try the latest update
Open a chart, ask a question, get the answer. More updates are coming as we continue building the most connected research platform for investors.
Join our newsletter to get early access to new Kimpton AI features and updates.