

Great research is not just about getting answers. It is about understanding how those answers were found. This update opens up Kimpton's reasoning process so you can see exactly what is happening as it researches your questions.
You can now watch Kimpton fetch data, analyze news, run calculations, and generate visualizations in real time. And when you find an insight worth sharing, you can send it directly to X or LinkedIn with a single click.
What's New
- Deep Research reasoning stream with live activity tracking
- Chart sharing to X, LinkedIn, and clipboard
- Agentic charting that generates visualizations automatically
- Redesigned interface with collapsible sidebar and improved navigation
- Full mobile support with touch-friendly design
Why This Matters
When you ask Kimpton a complex question, a lot happens behind the scenes. It pulls price data, scans news articles, checks prediction markets, runs Python code, and synthesizes everything into a coherent answer. Until now, that process was invisible.
The new reasoning stream changes that. You can see each step as it happens, understand what sources Kimpton is consulting, and follow along as it builds toward an answer. Research becomes a collaborative process instead of a black box.
New Features
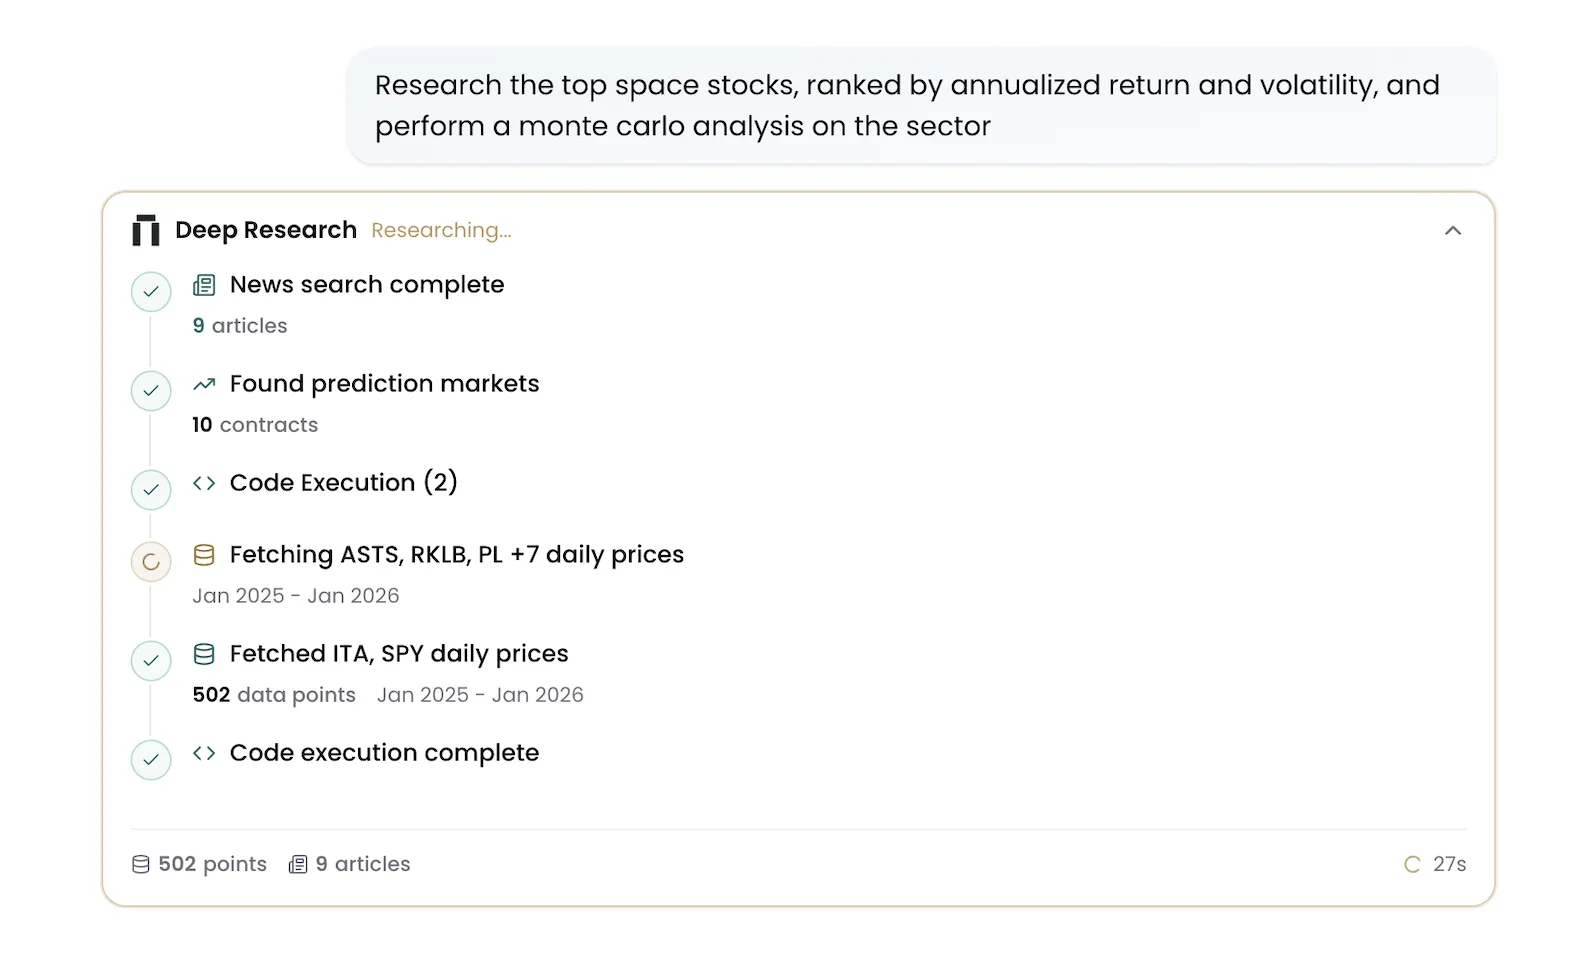
Deep Research Reasoning Stream
The reasoning stream shows you exactly what Kimpton is doing as it researches your question. Watch as it fetches market data, accesses your portfolio, queries prediction markets, executes code, searches news, and generates visualizations.
- Live activity feed showing each research step
- Real-time metrics: data points processed, articles analyzed, sources consulted
- Timer tracking total research duration
- Expandable and collapsible for focused reading
Each step is categorized by type so you can quickly understand what Kimpton is doing. Data fetches show how many data points were retrieved. News searches show how many articles were scanned. Code execution steps show when calculations are running.
Try asking
- “How did the top 5 tech stocks perform relative to the S&P 500 over the past month?”
- “What is the correlation between my portfolio and Bitcoin over the past year?”
- “Which sectors are most exposed to rising interest rates based on recent Fed commentary?”
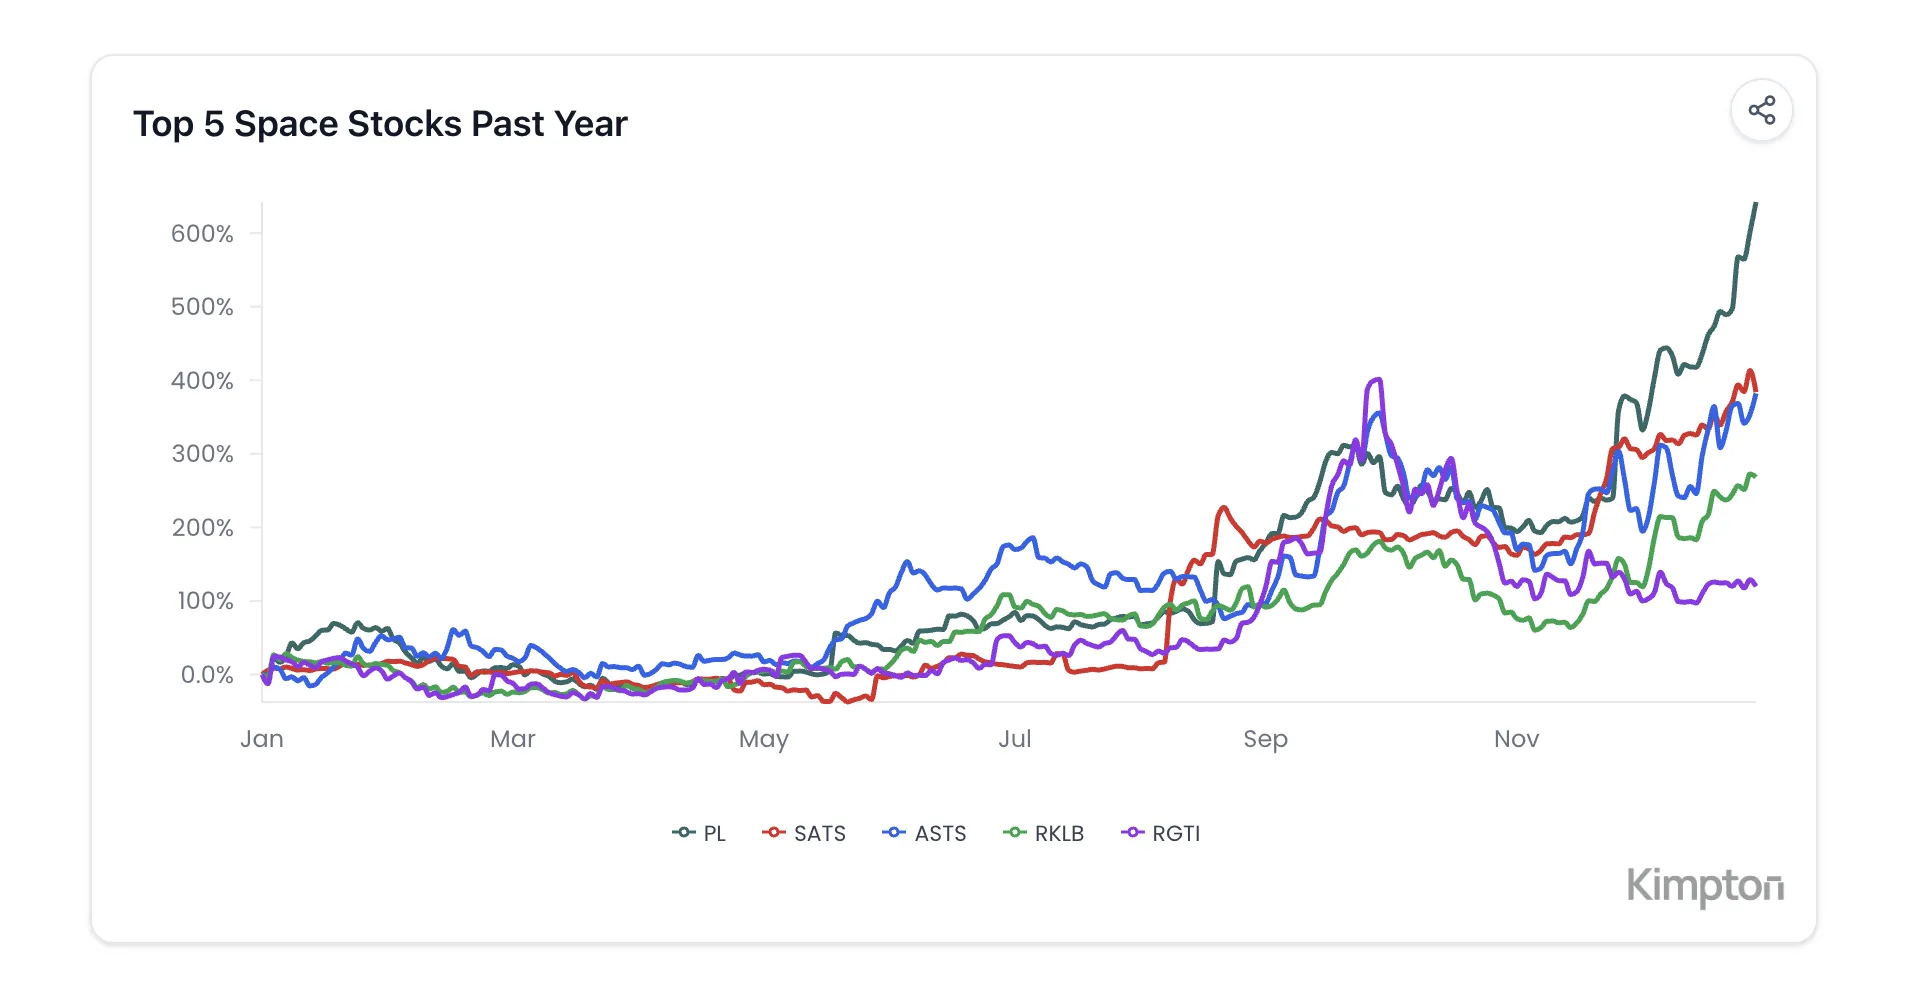
Agentic Charting
Kimpton now generates charts proactively as part of its research process. When a visualization would help answer your question, it automatically writes and executes Python code to create it. You do not need to ask for a chart. Kimpton anticipates when one would be useful.
- Live Python code execution for on-demand visualizations
- Charts generated automatically when relevant to your question
- Real-time market data reflected in every visualization
- Comparative analysis across any assets or timeframes
This is not static charting. Every visualization is generated fresh using live data and tailored to your specific question. Ask about correlations and get a correlation chart. Ask about performance and get a normalized comparison. The right chart appears automatically.
Try asking
- “Show me how NVDA and AMD have moved relative to each other this year.”
- “What does the rolling correlation between gold and the 10-year Treasury look like?”
- “Compare the drawdowns of my portfolio versus the S&P 500 over the past six months.”
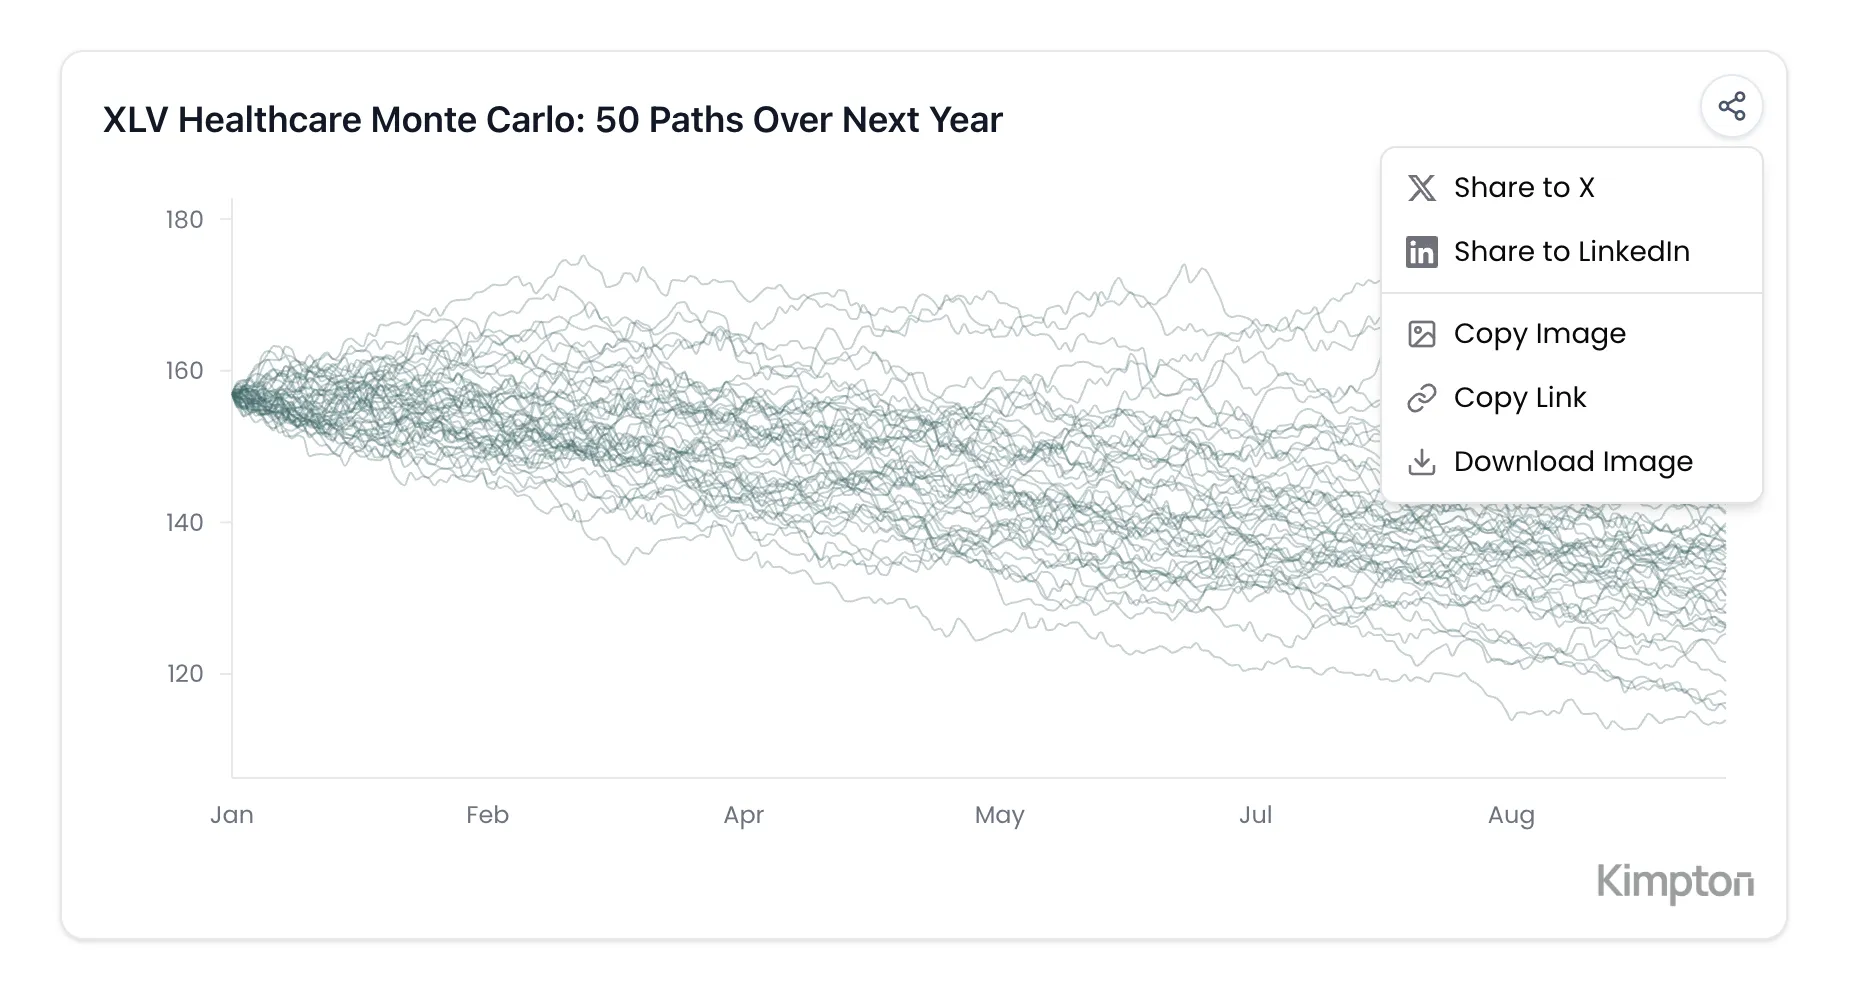
Share Charts to Social Media
Every chart Kimpton generates now includes a share button. Click it to share directly to X or LinkedIn, copy the image to your clipboard, or download it as a PNG. Shared charts include a subtle Kimpton watermark and generate rich previews when posted.
- One-click sharing to X (Twitter) and LinkedIn
- Copy image directly to clipboard
- Download as high-resolution PNG
- Shareable links with automatic preview images
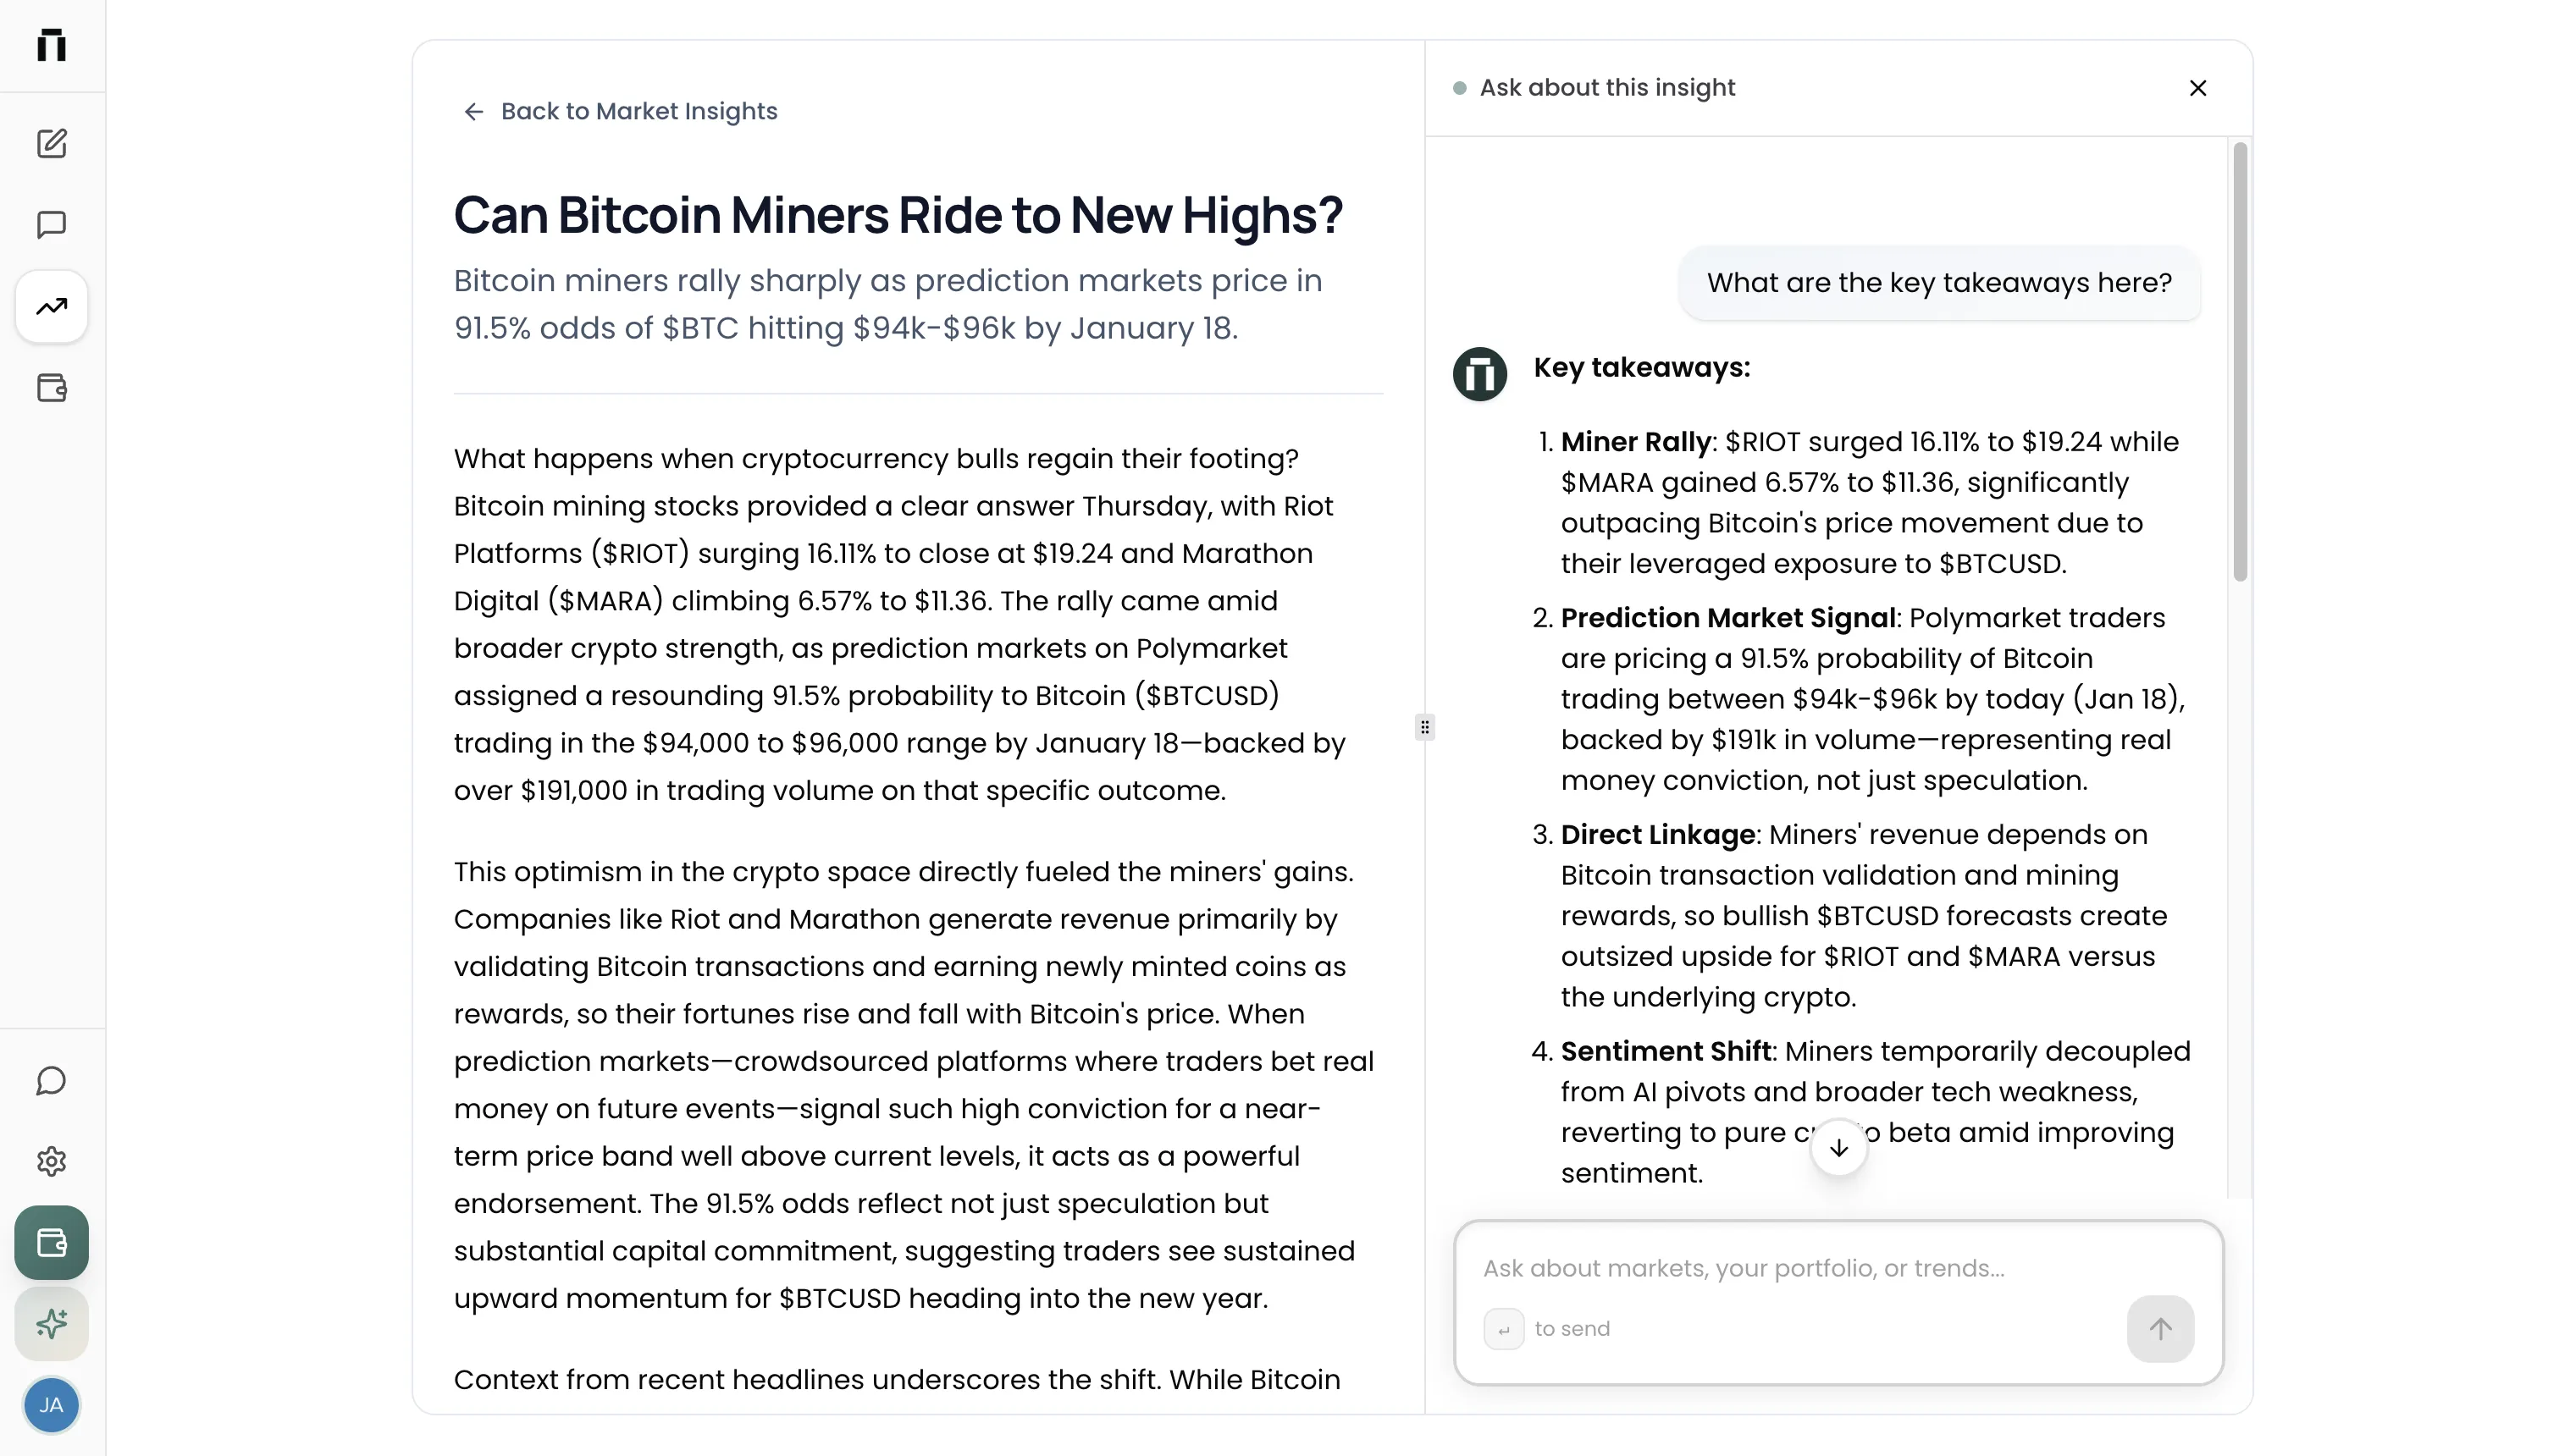
Redesigned Interface
The entire Kimpton interface has been rebuilt with a cleaner, more focused design. The new collapsible sidebar gives you more room to work while keeping everything accessible. Navigation is faster, threads are easier to find, and the overall experience feels more polished.
- Collapsible sidebar that expands on hover or click
- Thread search to quickly find past conversations
- Time-based thread grouping: today, yesterday, previous 7 days, and older
- Streamlined navigation between Deep Research, Market Insights, and Portfolio
The redesign keeps the features you rely on while removing clutter. Whether the sidebar is expanded or collapsed, you always have one-click access to start a new chat, switch between views, or pick up where you left off.
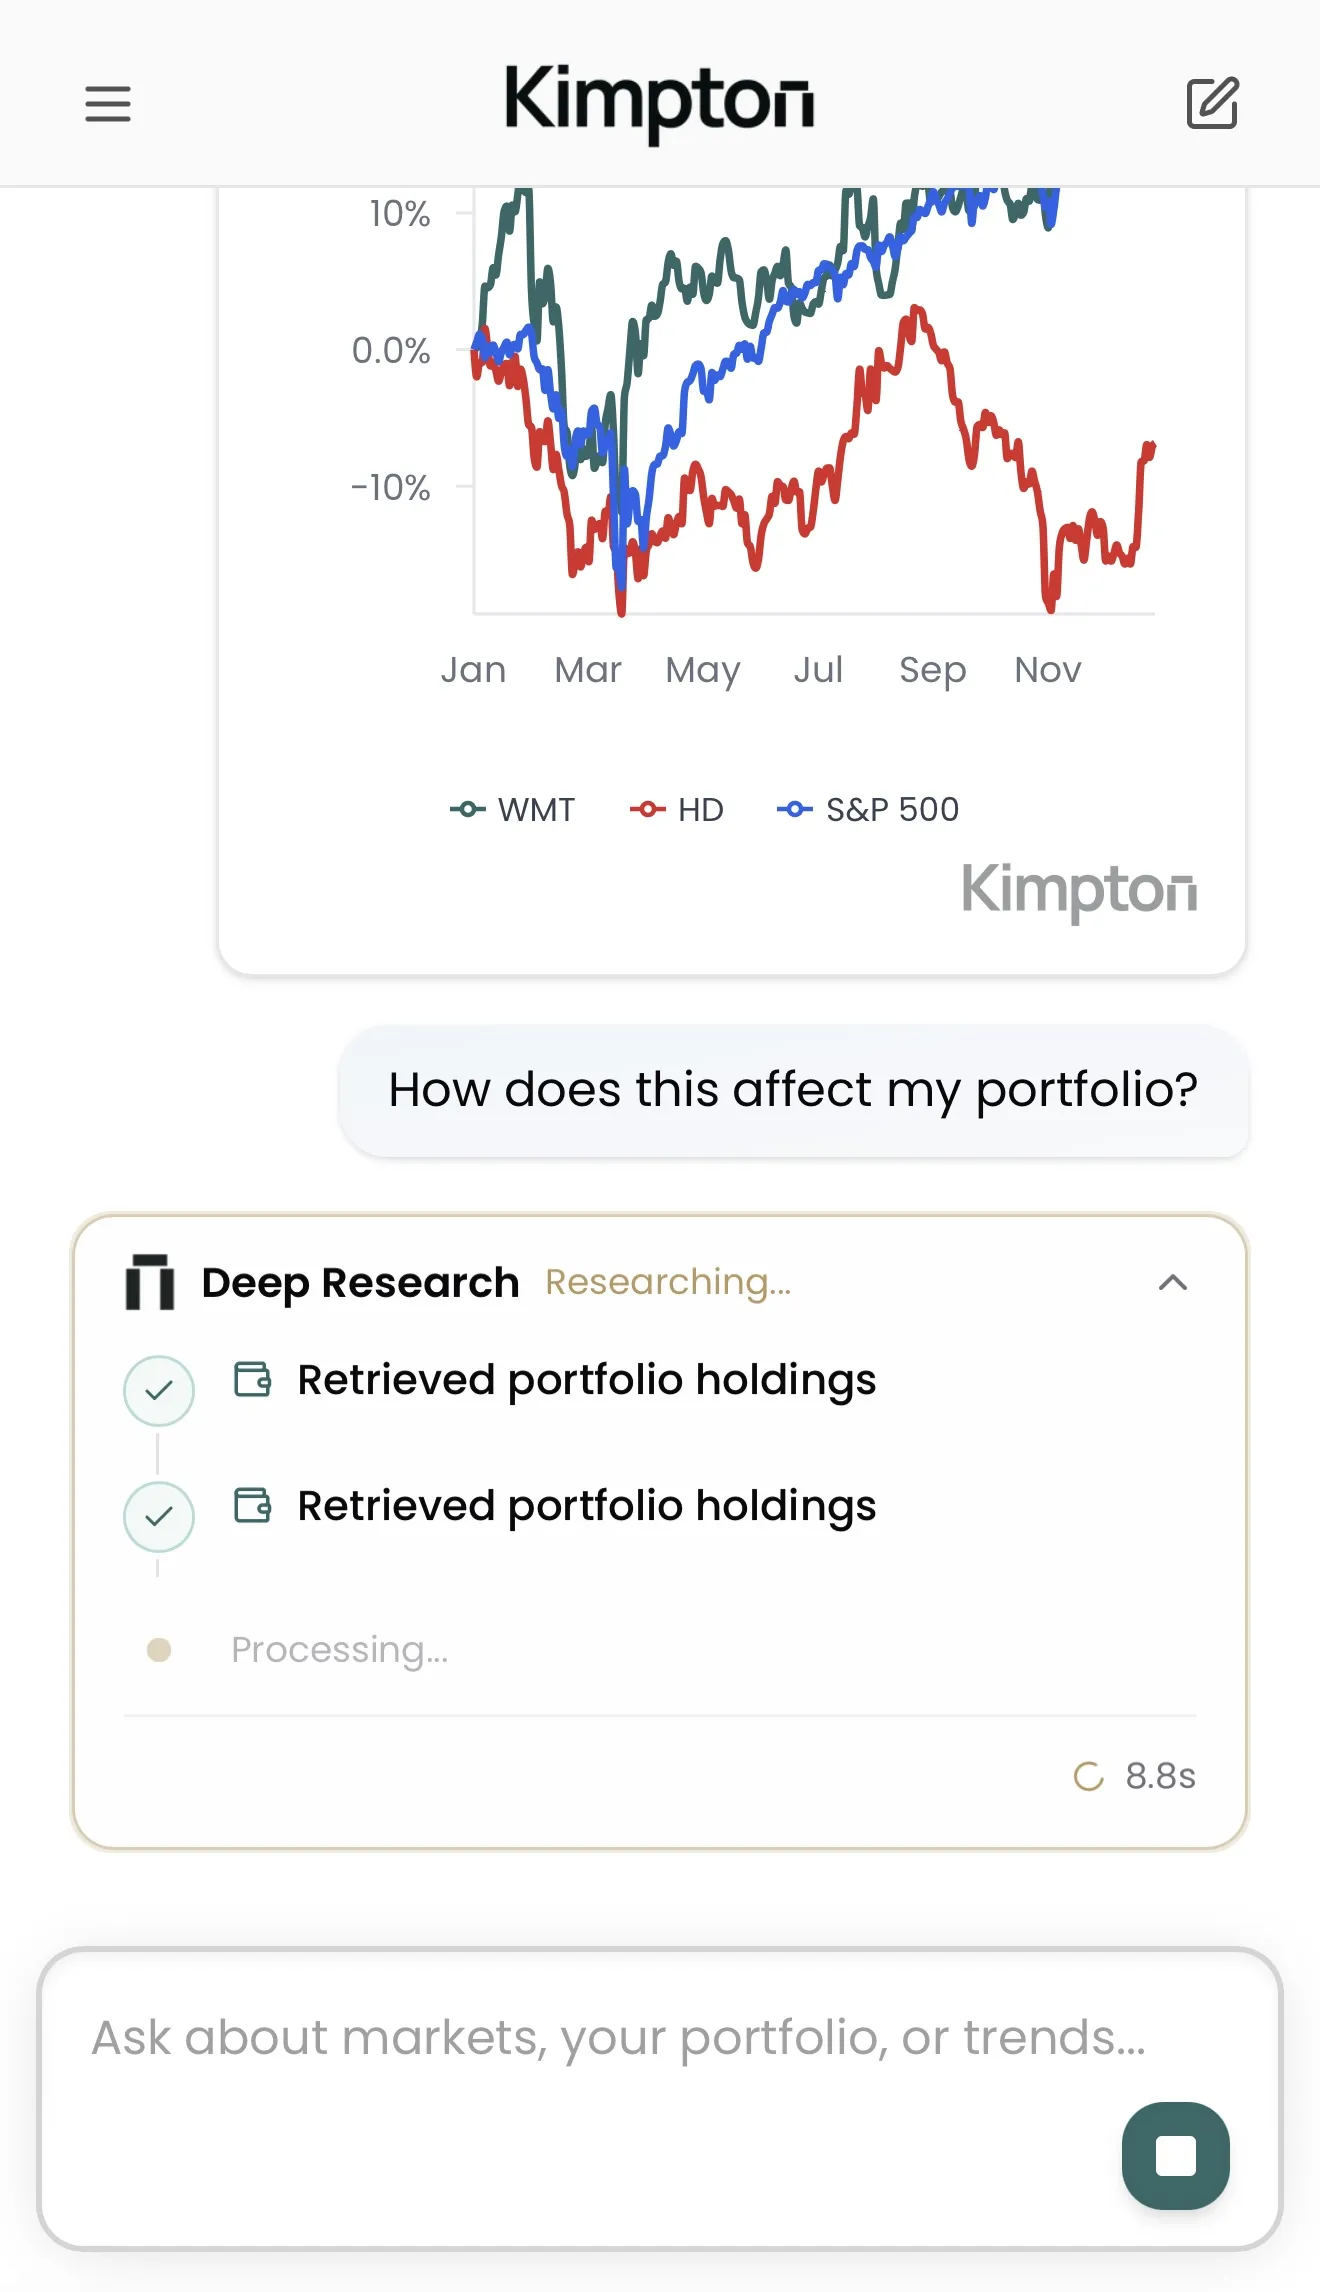
Full Mobile Support
Kimpton now works beautifully on your phone. The mobile experience is not a stripped-down version. It is the full platform, redesigned for touch. Access your portfolio, run Deep Research queries, and browse Market Insights from anywhere.
- Touch-optimized interface with slide-out navigation
- Full access to all threads and conversation history
- Mobile-friendly charts with responsive formatting
- Quick actions from the mobile header: new chat, navigation, and account
Portfolio charts automatically adapt to smaller screens with cleaner date labels and optimized data density. The reasoning stream, chart sharing, and every other feature work exactly as they do on desktop.
Try the latest update
Experience research that shows its work. More updates are on the way as we continue making Kimpton the most transparent and powerful research platform for investors.
Join our newsletter to get early access to new Kimpton AI features and updates.