

Research does not end at an answer. A good answer turns into a chart, a dashboard, a backtest, a report, or a model portfolio that the team can keep using. Kimpton is moving from a chat surface into a full research workspace.
This update brings generated work into an inline canvas, adds Pine Script backtesting, improves AI reports, and expands enterprise data access through model portfolios, a dedicated data gateway, and FactSet OAuth.
What's New
- Inline canvas panel for generated dashboards and reports
- Pine Script backtesting from the chart sidebar
- AI reports added to the Pro research tier
- Model portfolios for reusable portfolio context
- Dedicated data gateway for market data requests
- FactSet OAuth integration for Enterprise users
- Chart reliability, scroll-back, and viewport polish
Why This Matters
Chat is a strong starting point, but investment work needs durable outputs. You need to keep a dashboard open, rerun a backtest, export a report, and return to the same portfolio context later.
The canvas turns generated research into artifacts that can live beside the conversation. Backtesting and enterprise data support make those artifacts more useful for serious workflows.
Infinite Canvas
Kimpton can now render dashboards and reports into an inline canvas panel. Instead of losing generated work inside a chat transcript, you can inspect it in a persistent workspace and continue the conversation around it.
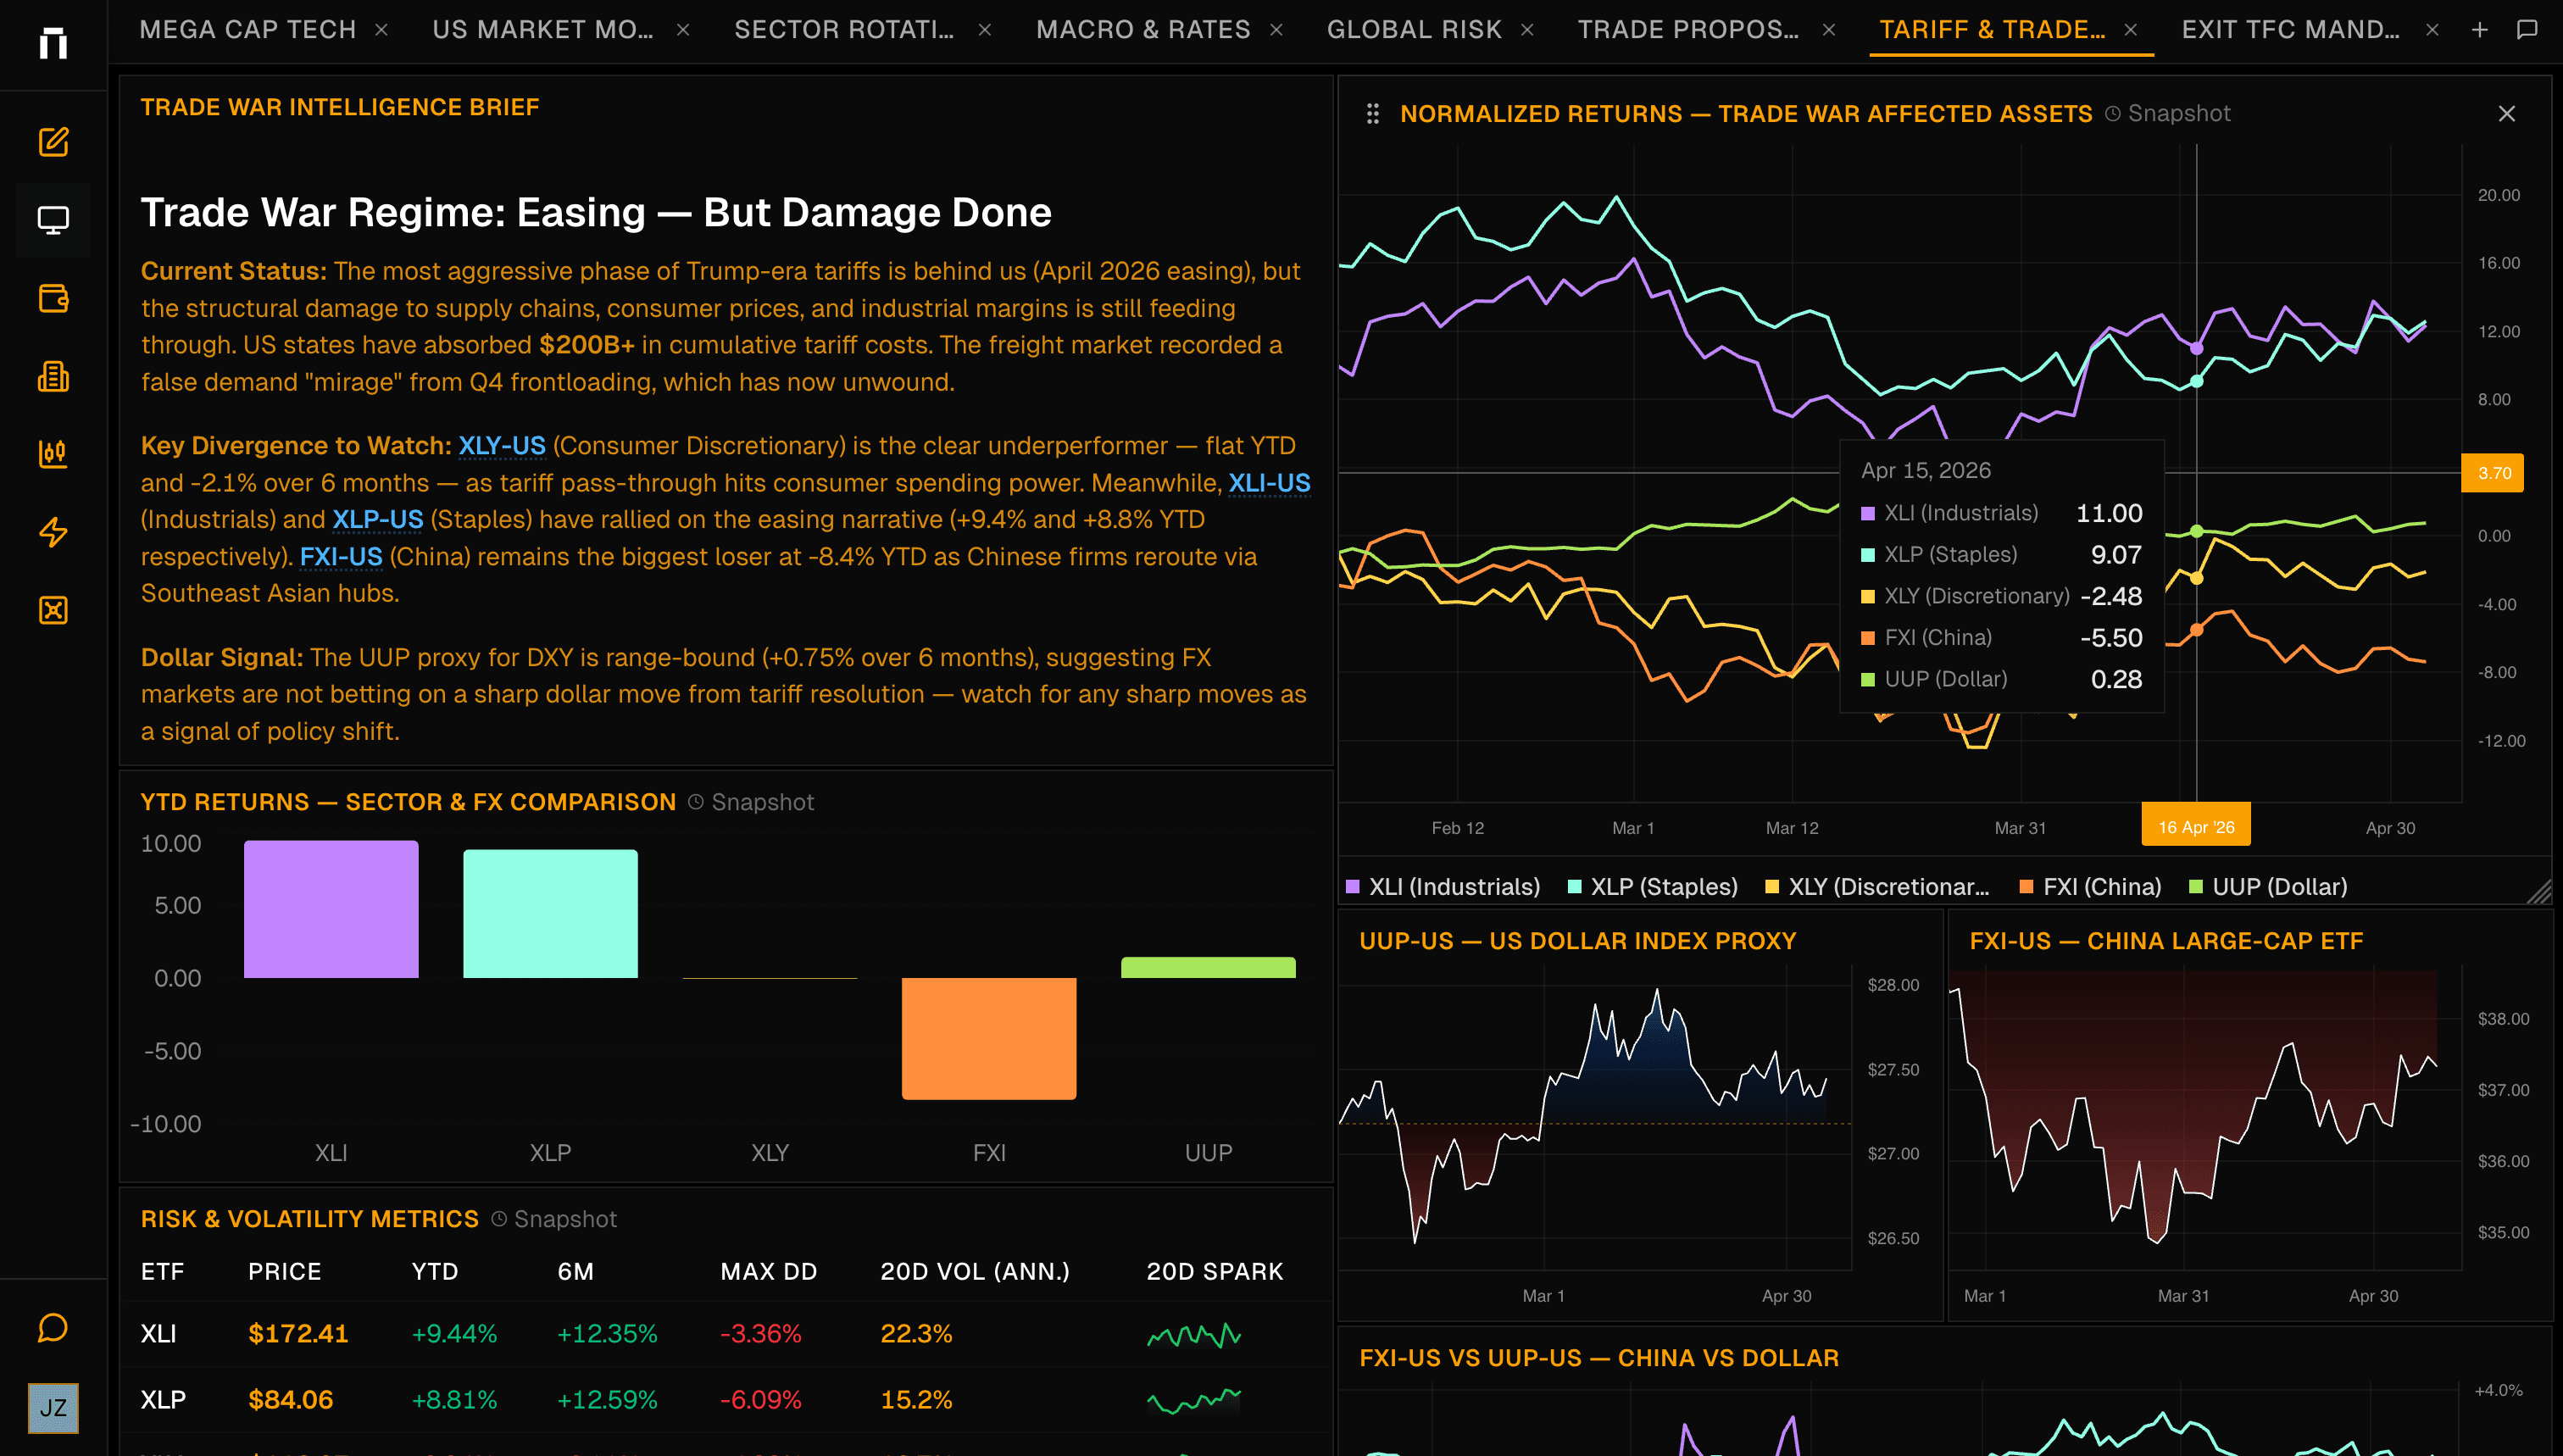
- Generated dashboards render into a dedicated canvas panel
- Reports can be viewed beside the chat that created them
- Follow-up prompts can add to or revise existing outputs
- Canvas artifacts stay connected to the research thread
Backtesting
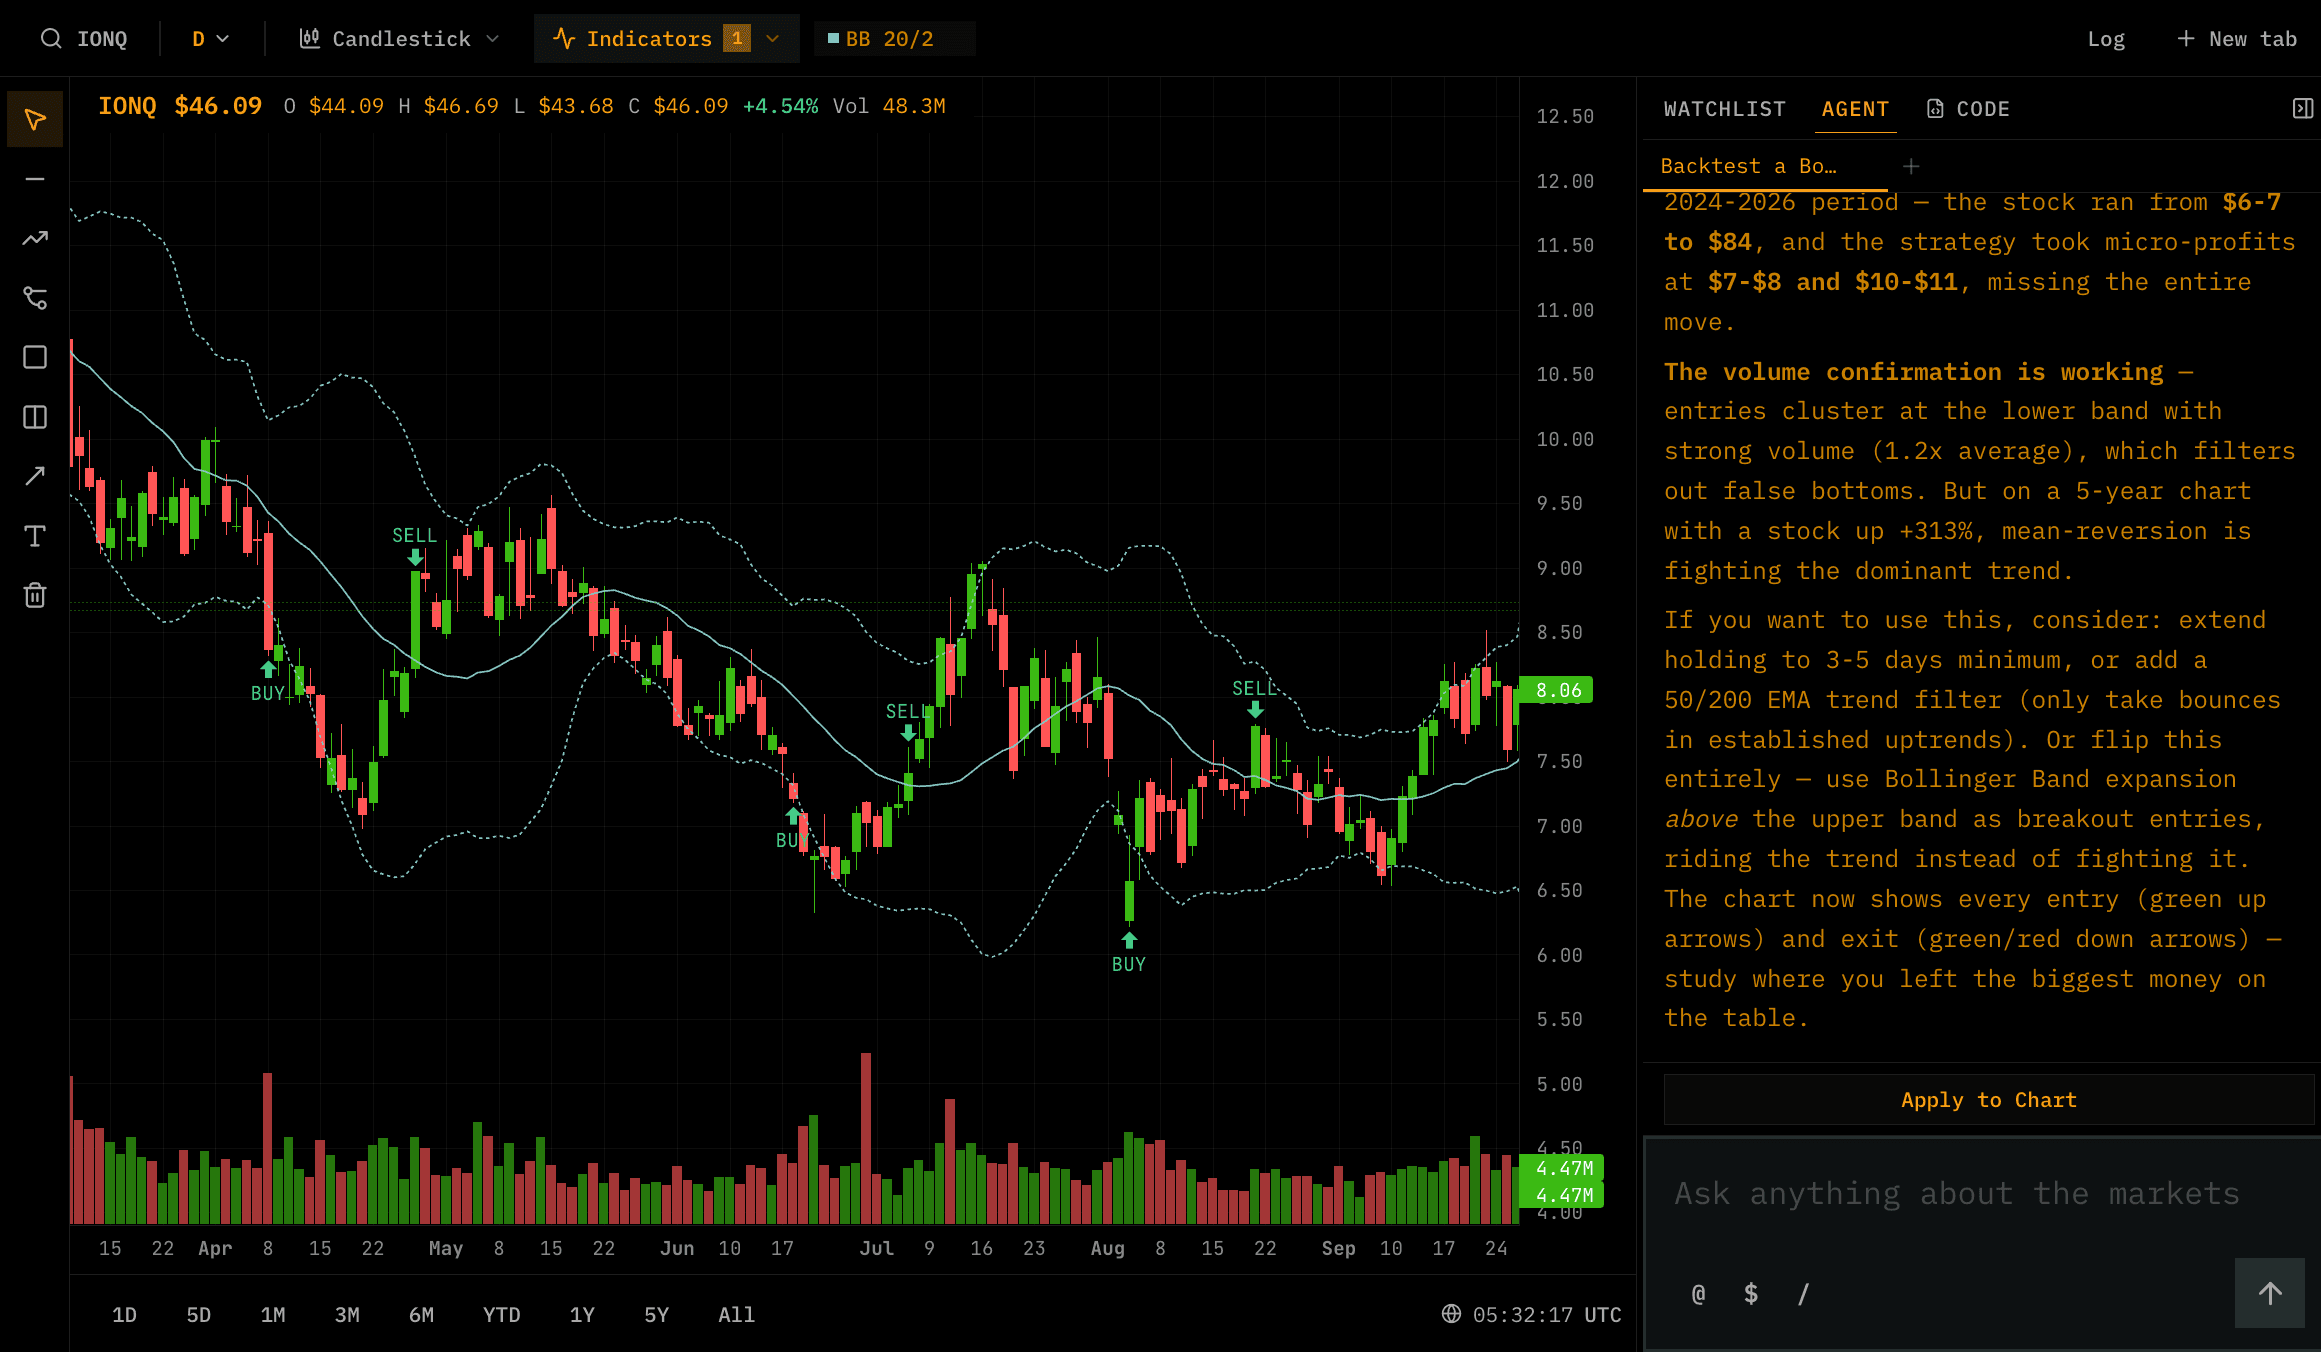
Pine Script backtesting adds a strategy layer to the chart workspace. Write or generate a script, run it from the chart sidebar, rerun it as assumptions change, and preserve chart annotations across navigation.
Try asking
- “Backtest a moving average crossover on $SPY over the last five years”
- “Show where this strategy entered and exited $NVDA”
- “Compare this backtest with buy and hold”
- “Create a dashboard from the backtest results”
Reports
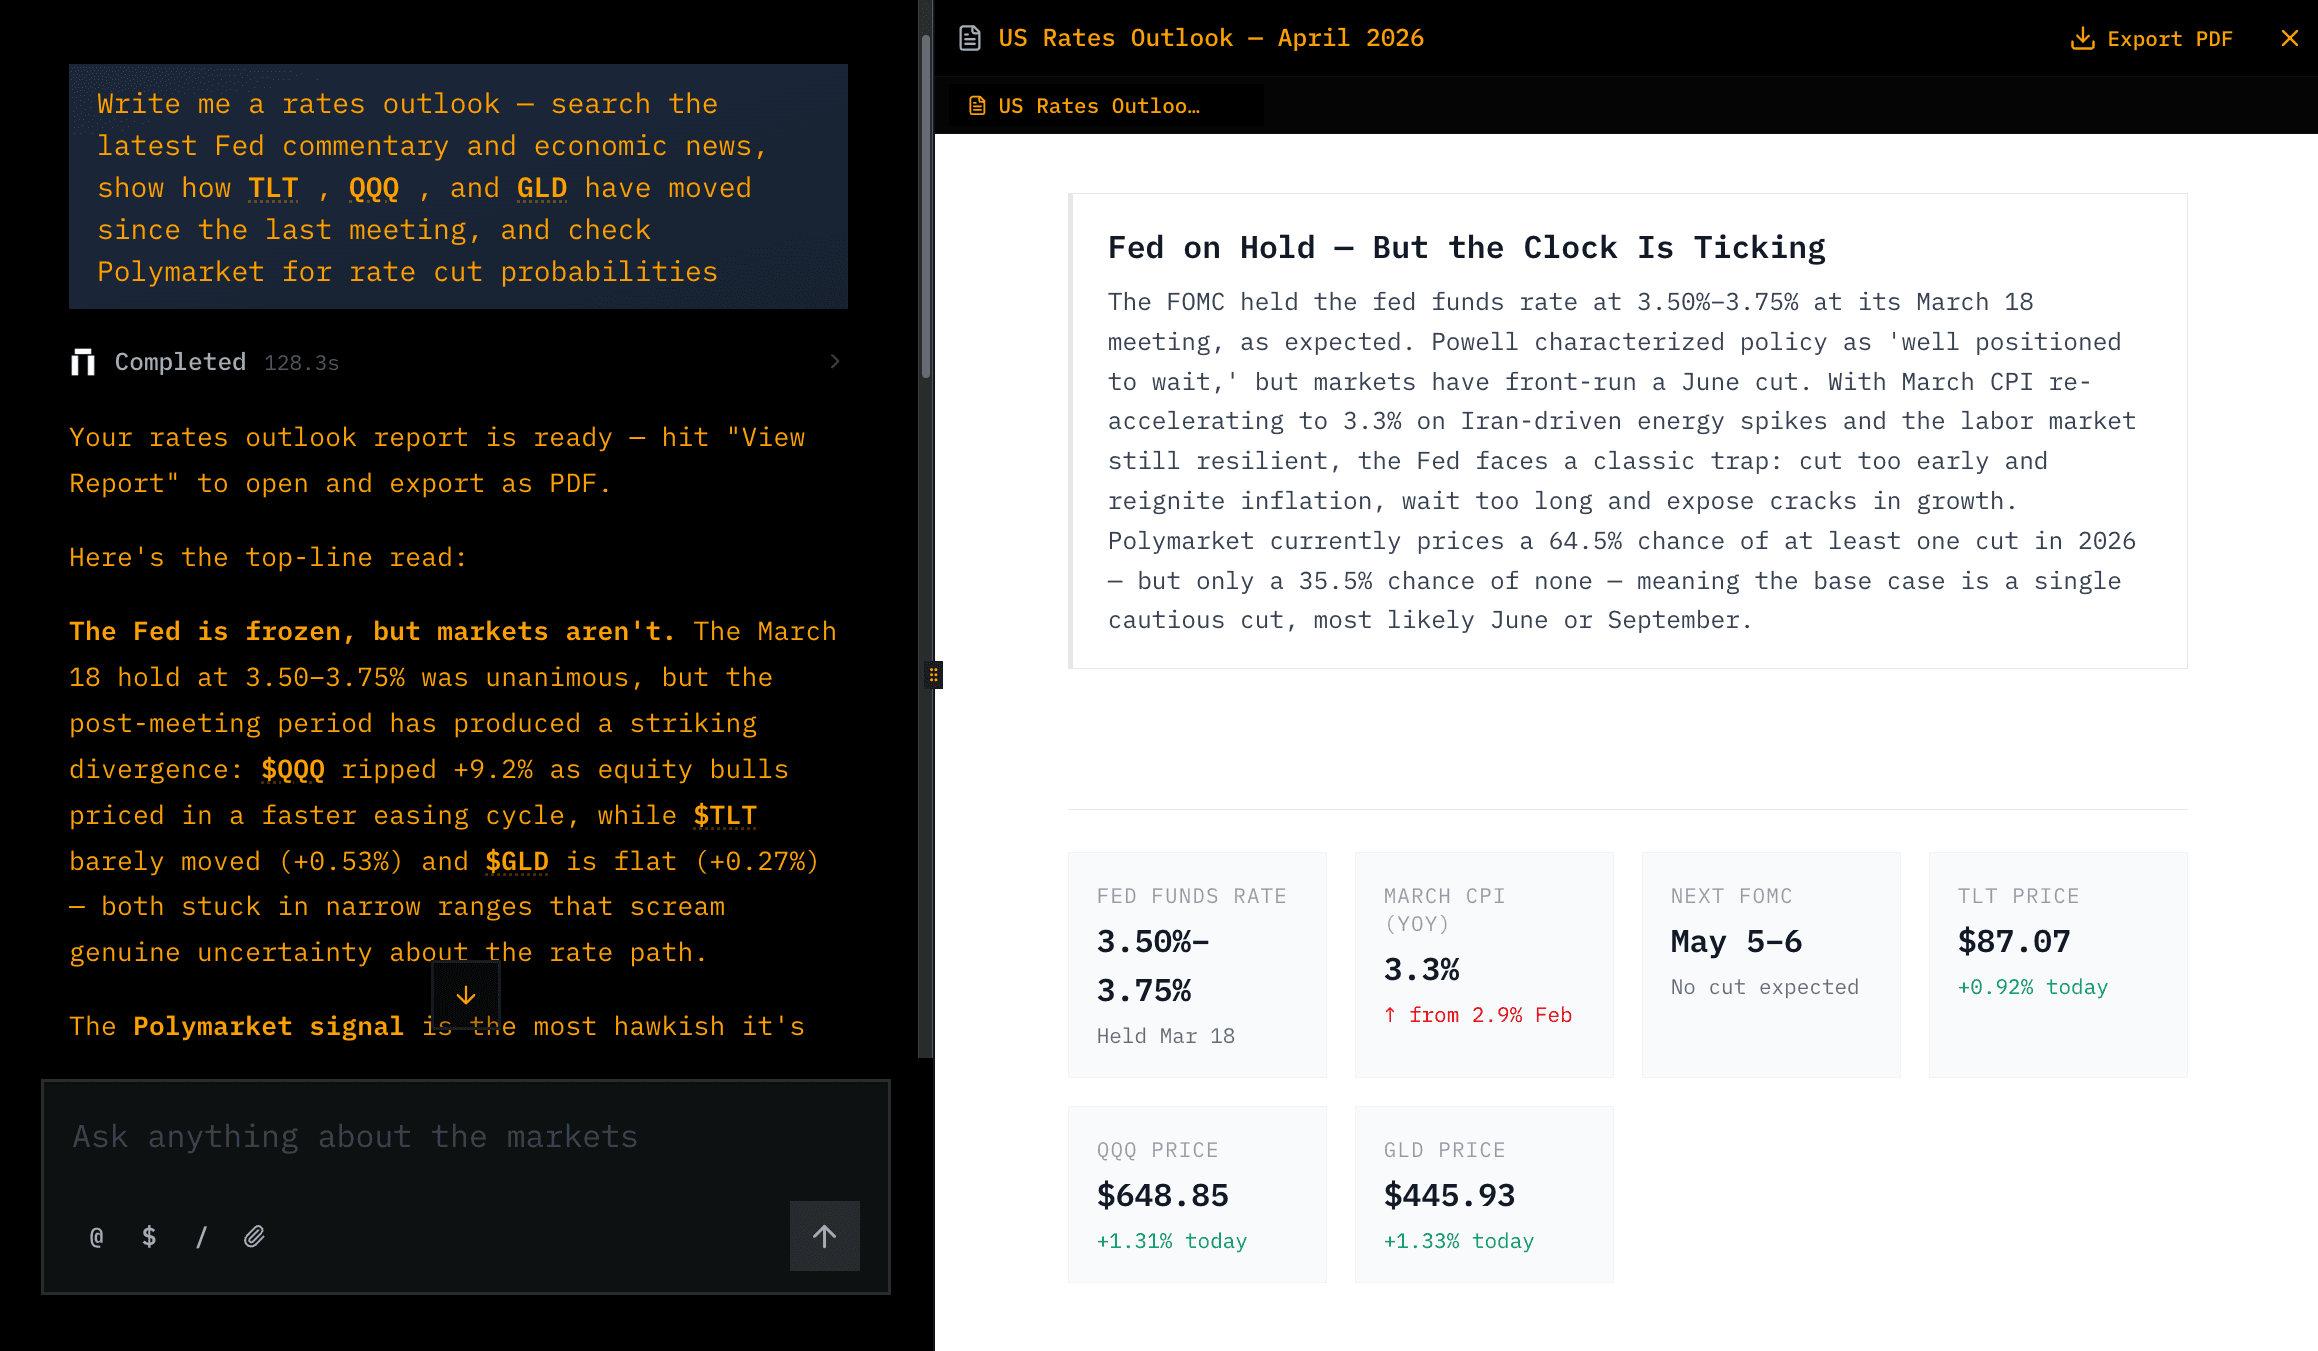
Reports are now part of the product surface, not just a one-off response. Kimpton can generate richer report outputs, render them in the canvas, and support more reliable export and viewing flows as the report evolves.
Enterprise Data
We also expanded the enterprise data layer. Model portfolios create reusable portfolio context, the data gateway centralizes market-data access, and FactSet OAuth gives Enterprise users a path to bring institutional data into Kimpton workflows.
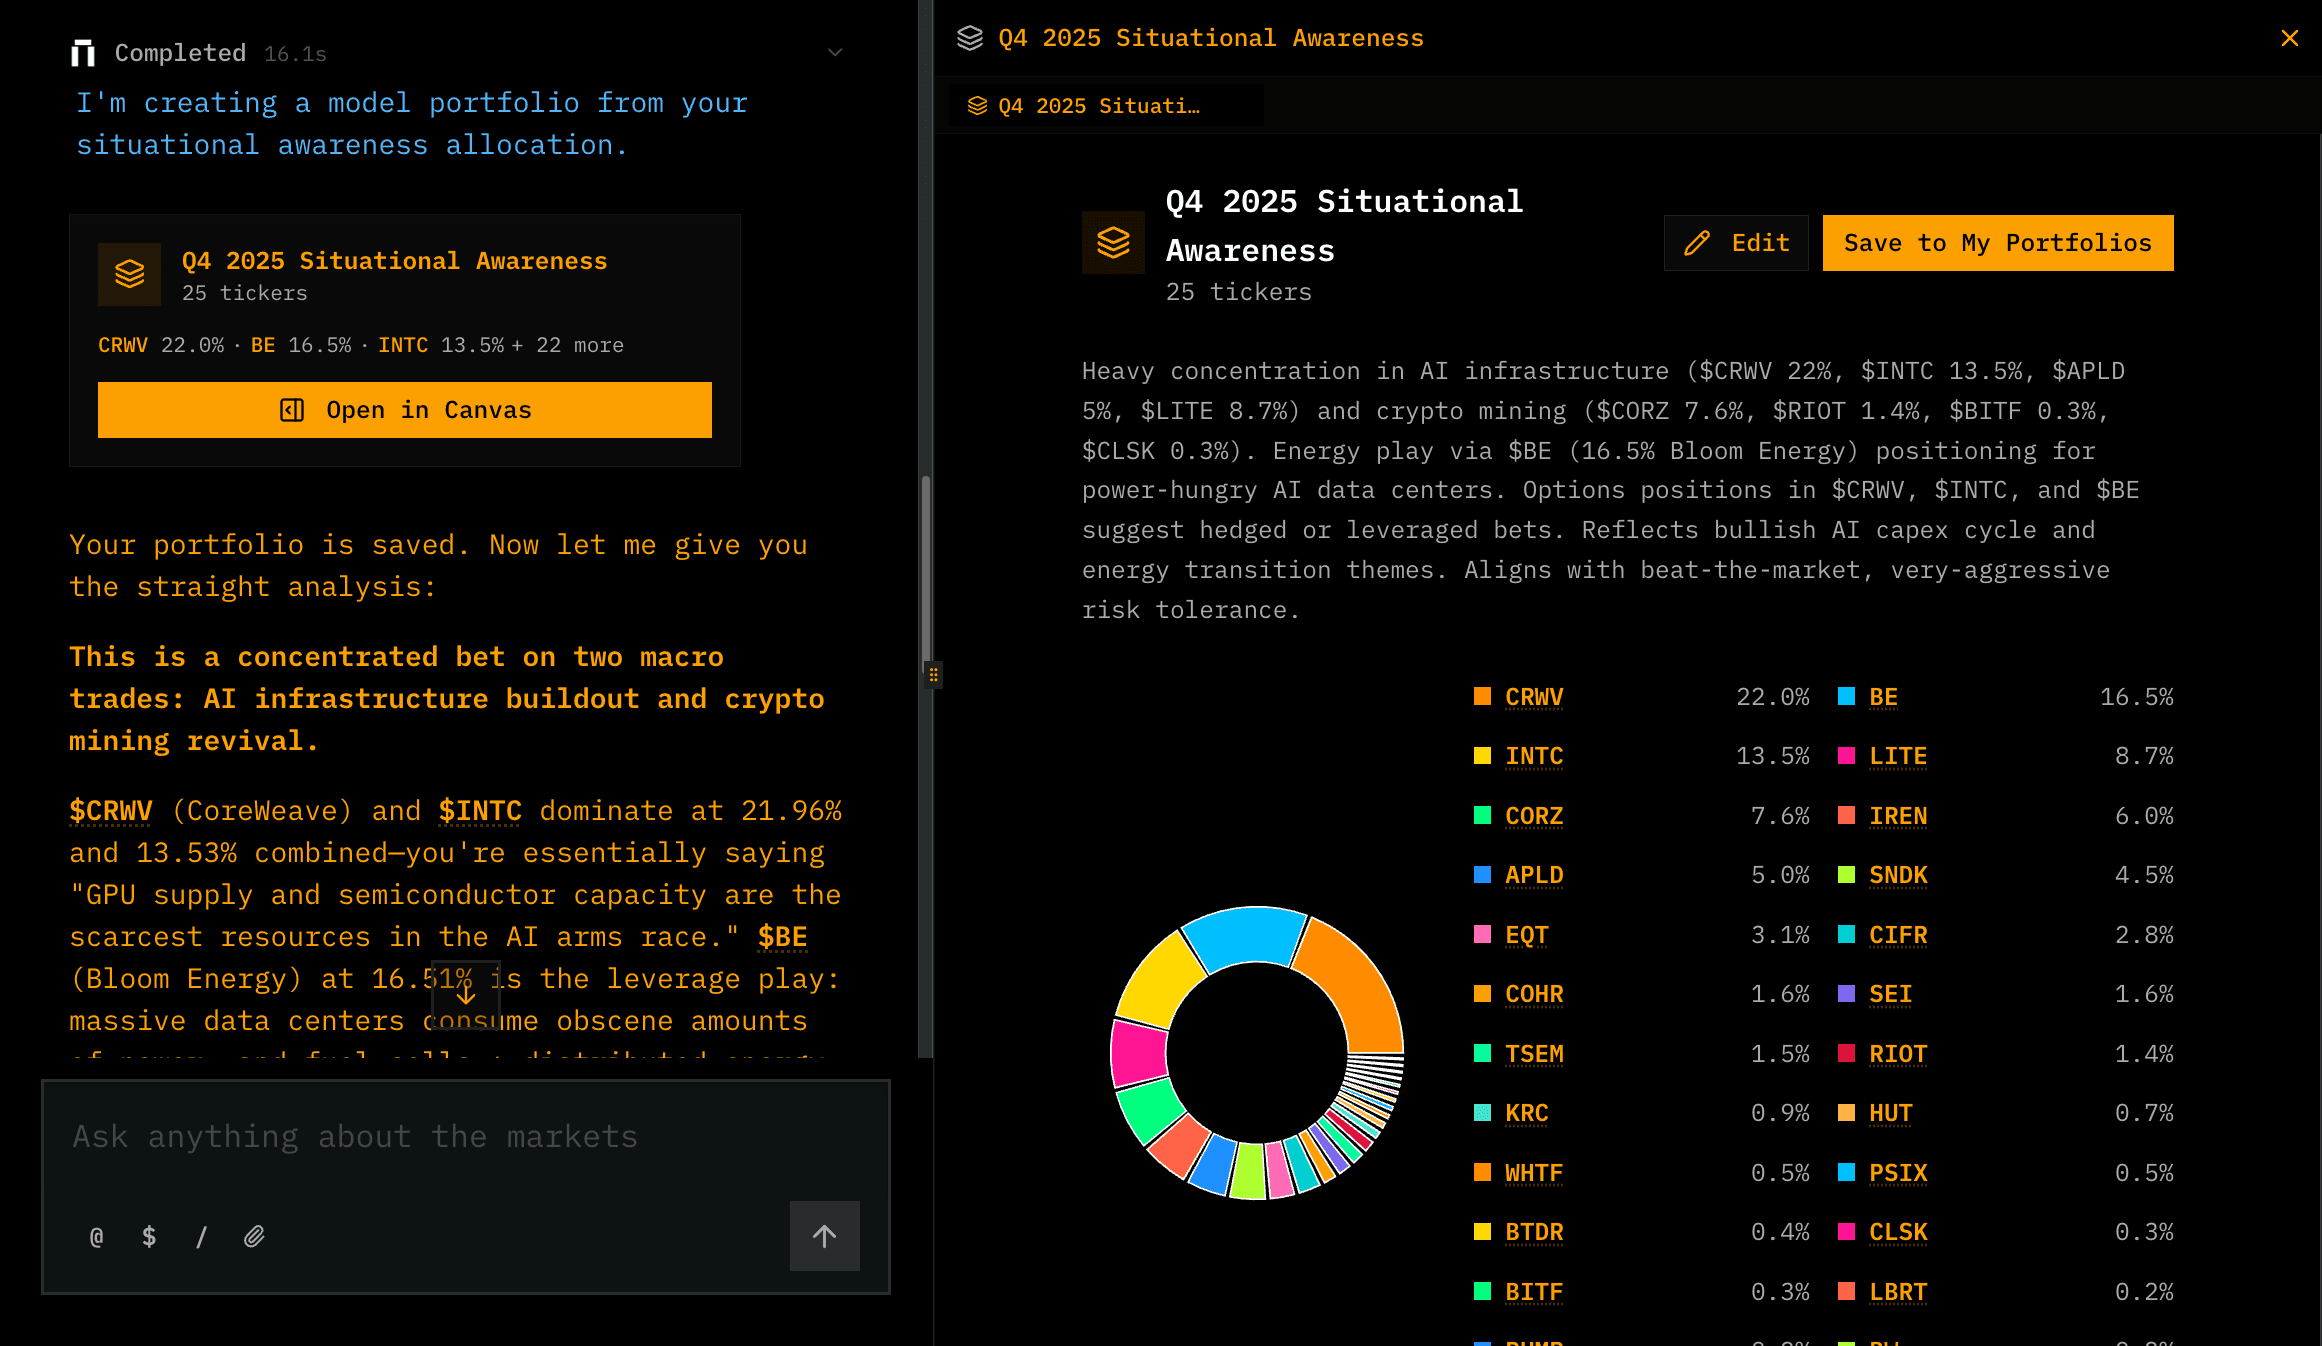
- Model portfolios for reusable portfolio analysis
- Tiingo market data routed through a dedicated gateway
- FactSet OAuth for Enterprise users
- More reliable chart data loading and asset pages
Try the latest update
Ask Kimpton to build a report, generate a dashboard, or backtest a strategy, then keep working with the result in the canvas.
Join our newsletter to get early access to new Kimpton AI features and updates.