
Charts are where market questions become specific. You can read a headline, scan a valuation table, or ask for a summary, but the question usually sharpens when you see price, volume, and context on the same screen.
This update makes Kimpton's chart research smoother and more connected. Charts now render more reliably inside answers, ticker mentions carry better context into visual output, and the chart workspace gives you more control while Kimpton works.
What's New
- Inline mini charts for single-ticker price questions
- More reliable chart rendering from $ticker references
- Queued follow-up messages while Deep Research is running
- Smoother typewriter animation and cleaner streaming behavior
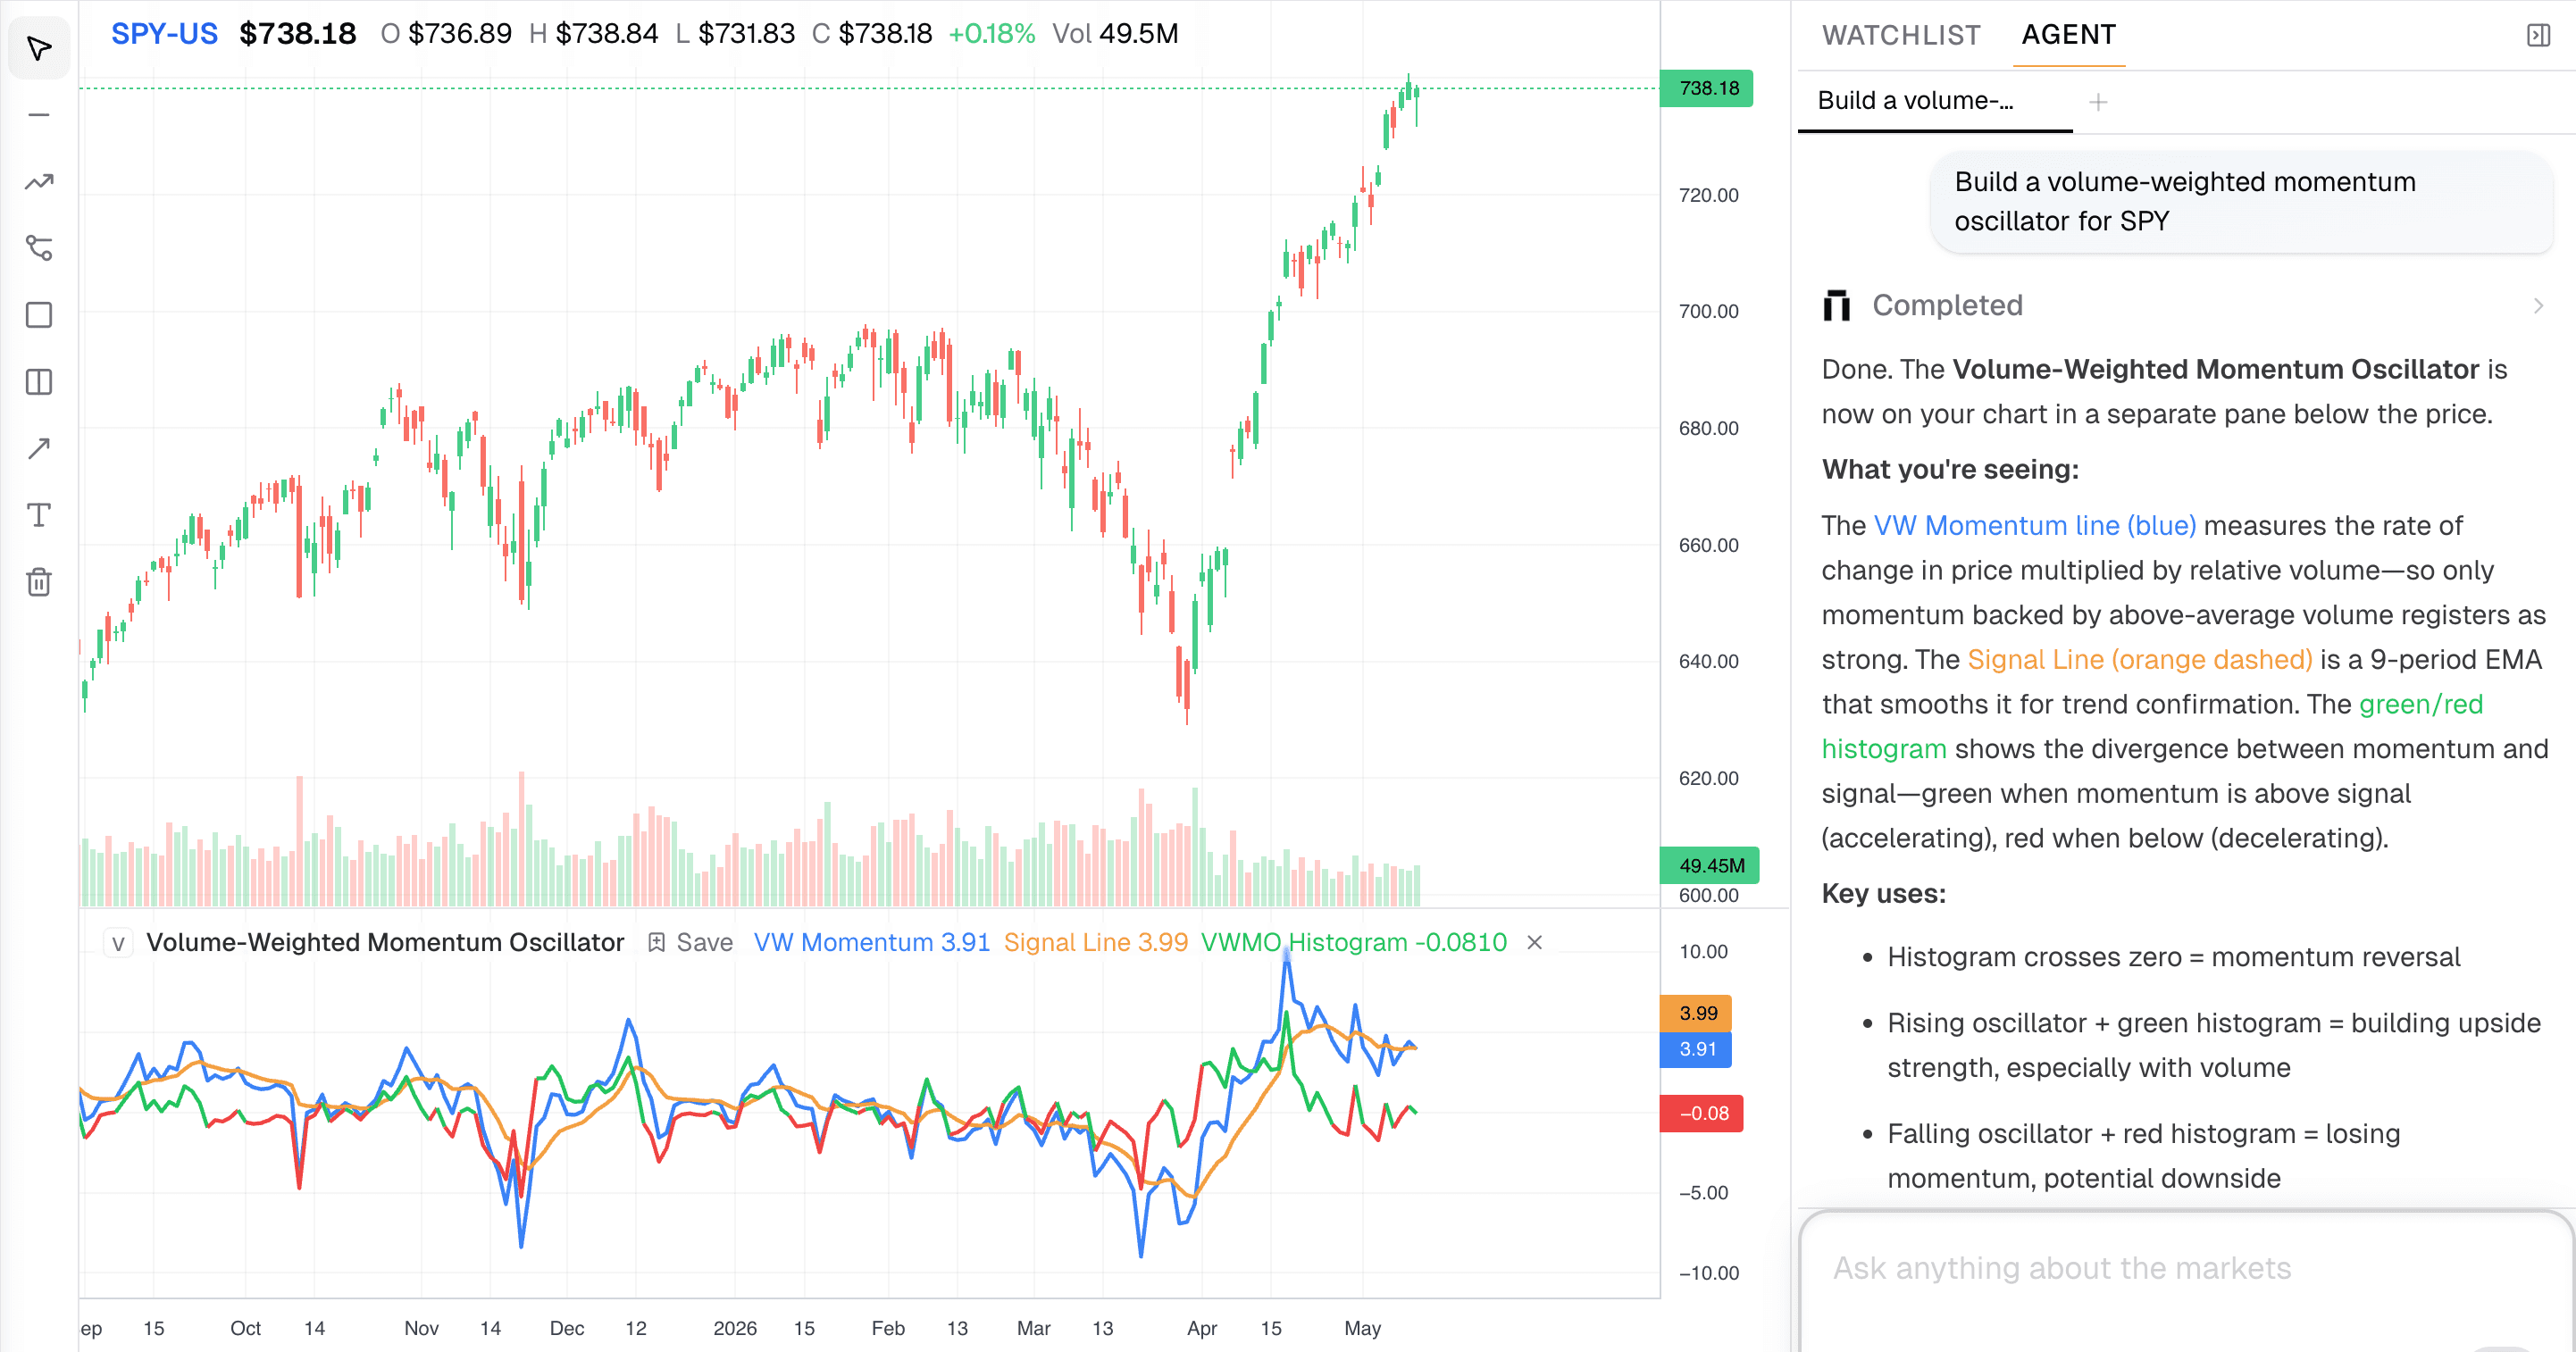
- Technical indicators and early backtesting support
- Log scale toggle, marker click detection, and stop controls
- Mobile chart UX and no-data flash fixes
Why This Matters
Research should not break when you move between a question and a chart. If you ask about $NVDA, Kimpton should understand that context, render the right visualization, and let you keep asking follow-ups without waiting for the current run to fully finish.
The chart workspace is becoming a place where price action, AI reasoning, indicators, and backtests can all live together.
Inline Charts
Single-ticker price questions now produce a more consistent inline chart experience. Mini charts render directly in the answer, ticker symbols are preserved more carefully, and ticker references are more likely to produce the chart you expected.
Try asking
- “Show me $AAPL over the last month”
- “What changed in $NVDA this week?”
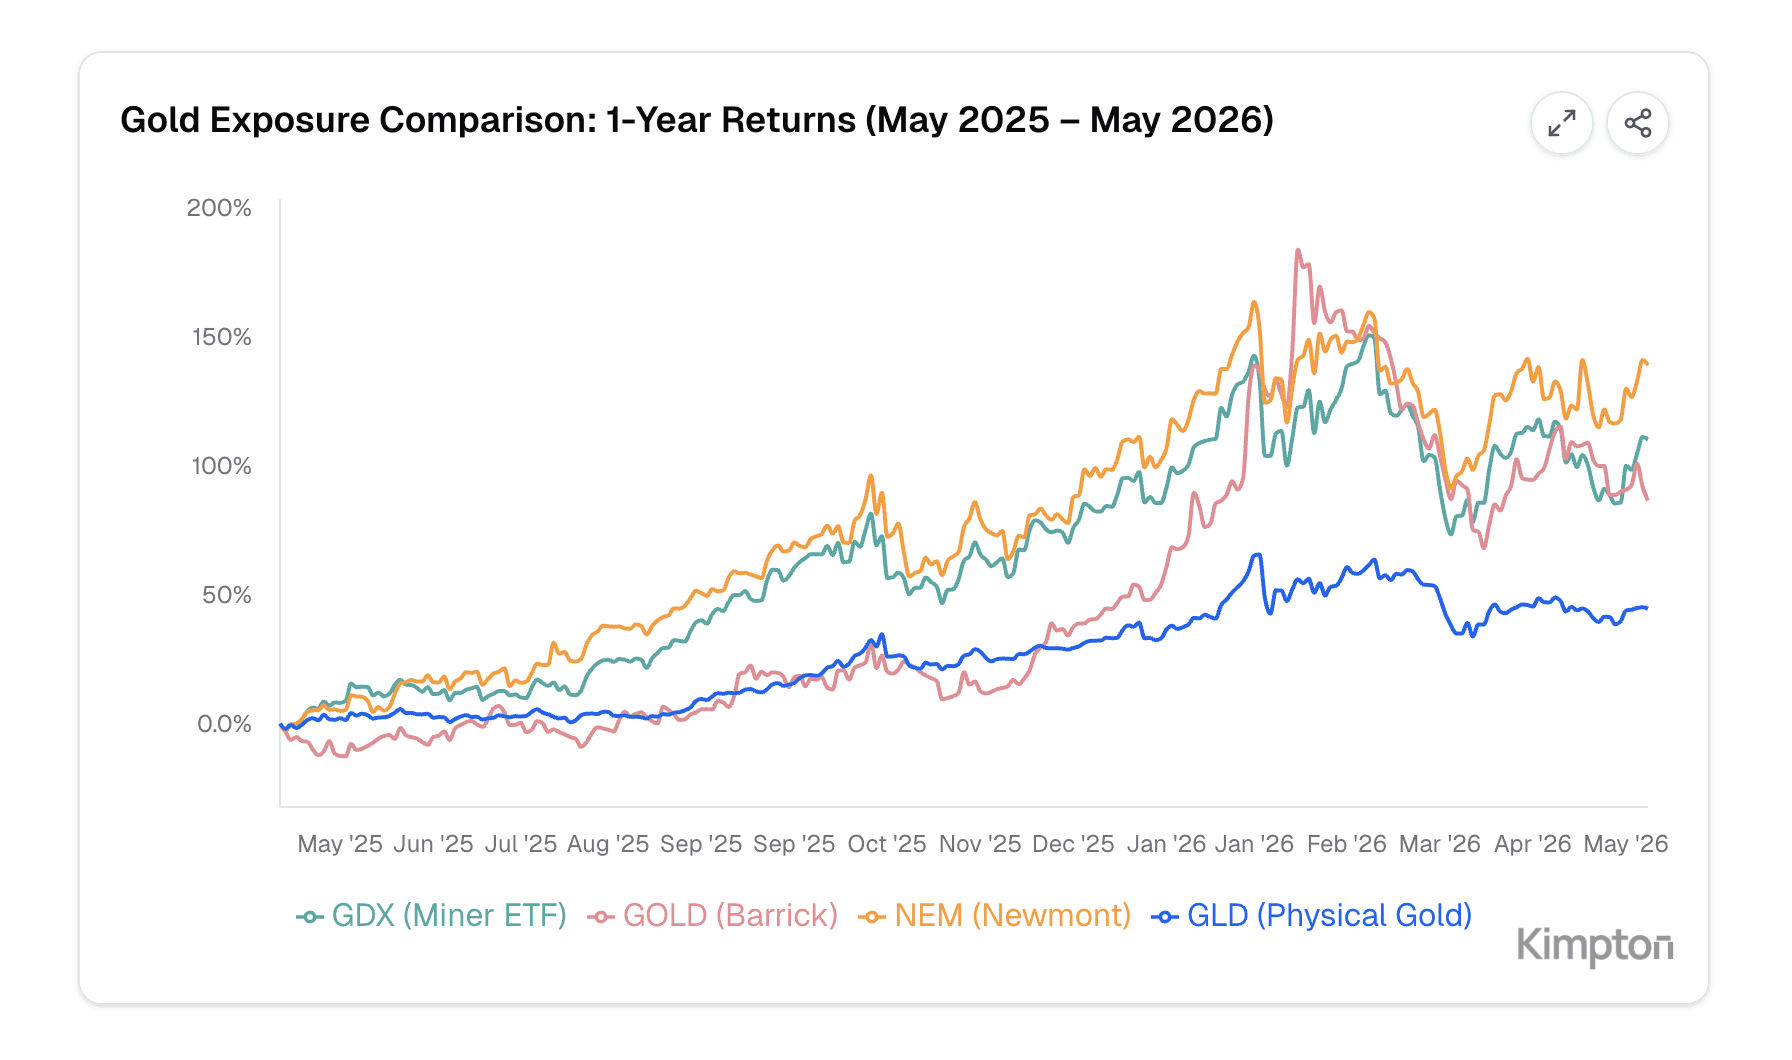
- “Compare $BTCUSD to $GC over the past year”
- “Render a chart for $MSFT with the latest price context”
Research Flow
You can now type and queue follow-up messages while Deep Research is still running. This keeps the workflow closer to how people actually think: ask the first question, notice the next one, and keep moving without waiting for the full response to finish.
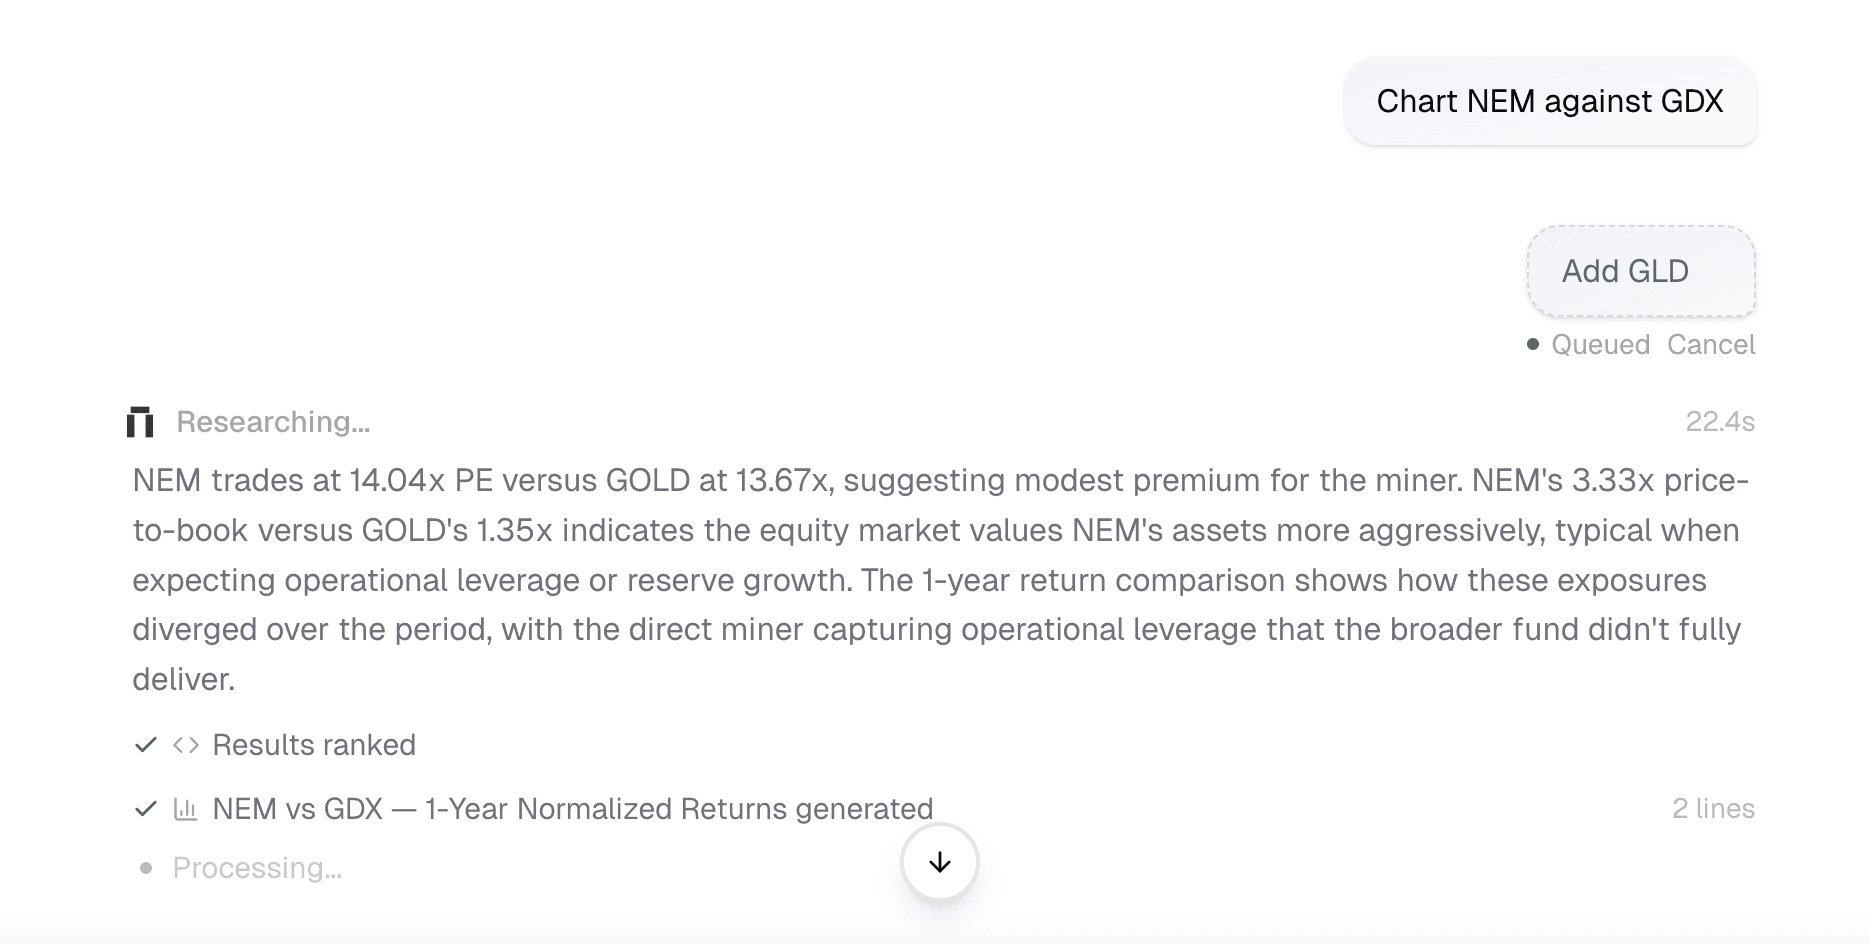
- Queue follow-ups during long research runs
- Stop an active response from the chart workspace
- Use Escape to halt streaming when you want to redirect
- See smoother streamed text and tool-step rendering
Chart Controls
The chart workspace also picked up practical controls for deeper analysis: log scale, marker click detection, cleaner oscillator controls, better mobile layout, and early indicator/backtest improvements.

- Log scale toggle in the chart toolbar
- Click detection for backtest markers
- Cleaner indicator removal controls
- Mobile-friendly chart page improvements
- Less stale data flashing during ticker and timeframe changes
Try the latest update
Open a chart, reference a ticker with $, and keep asking follow-ups while Kimpton works through the data.
Join our newsletter to get early access to new Kimpton AI features and updates.