
Investment work rarely fits inside one answer. You need a dashboard to monitor the thesis, a watchlist to track the names, a portfolio view to understand exposure, and a trade proposal when the research turns actionable.
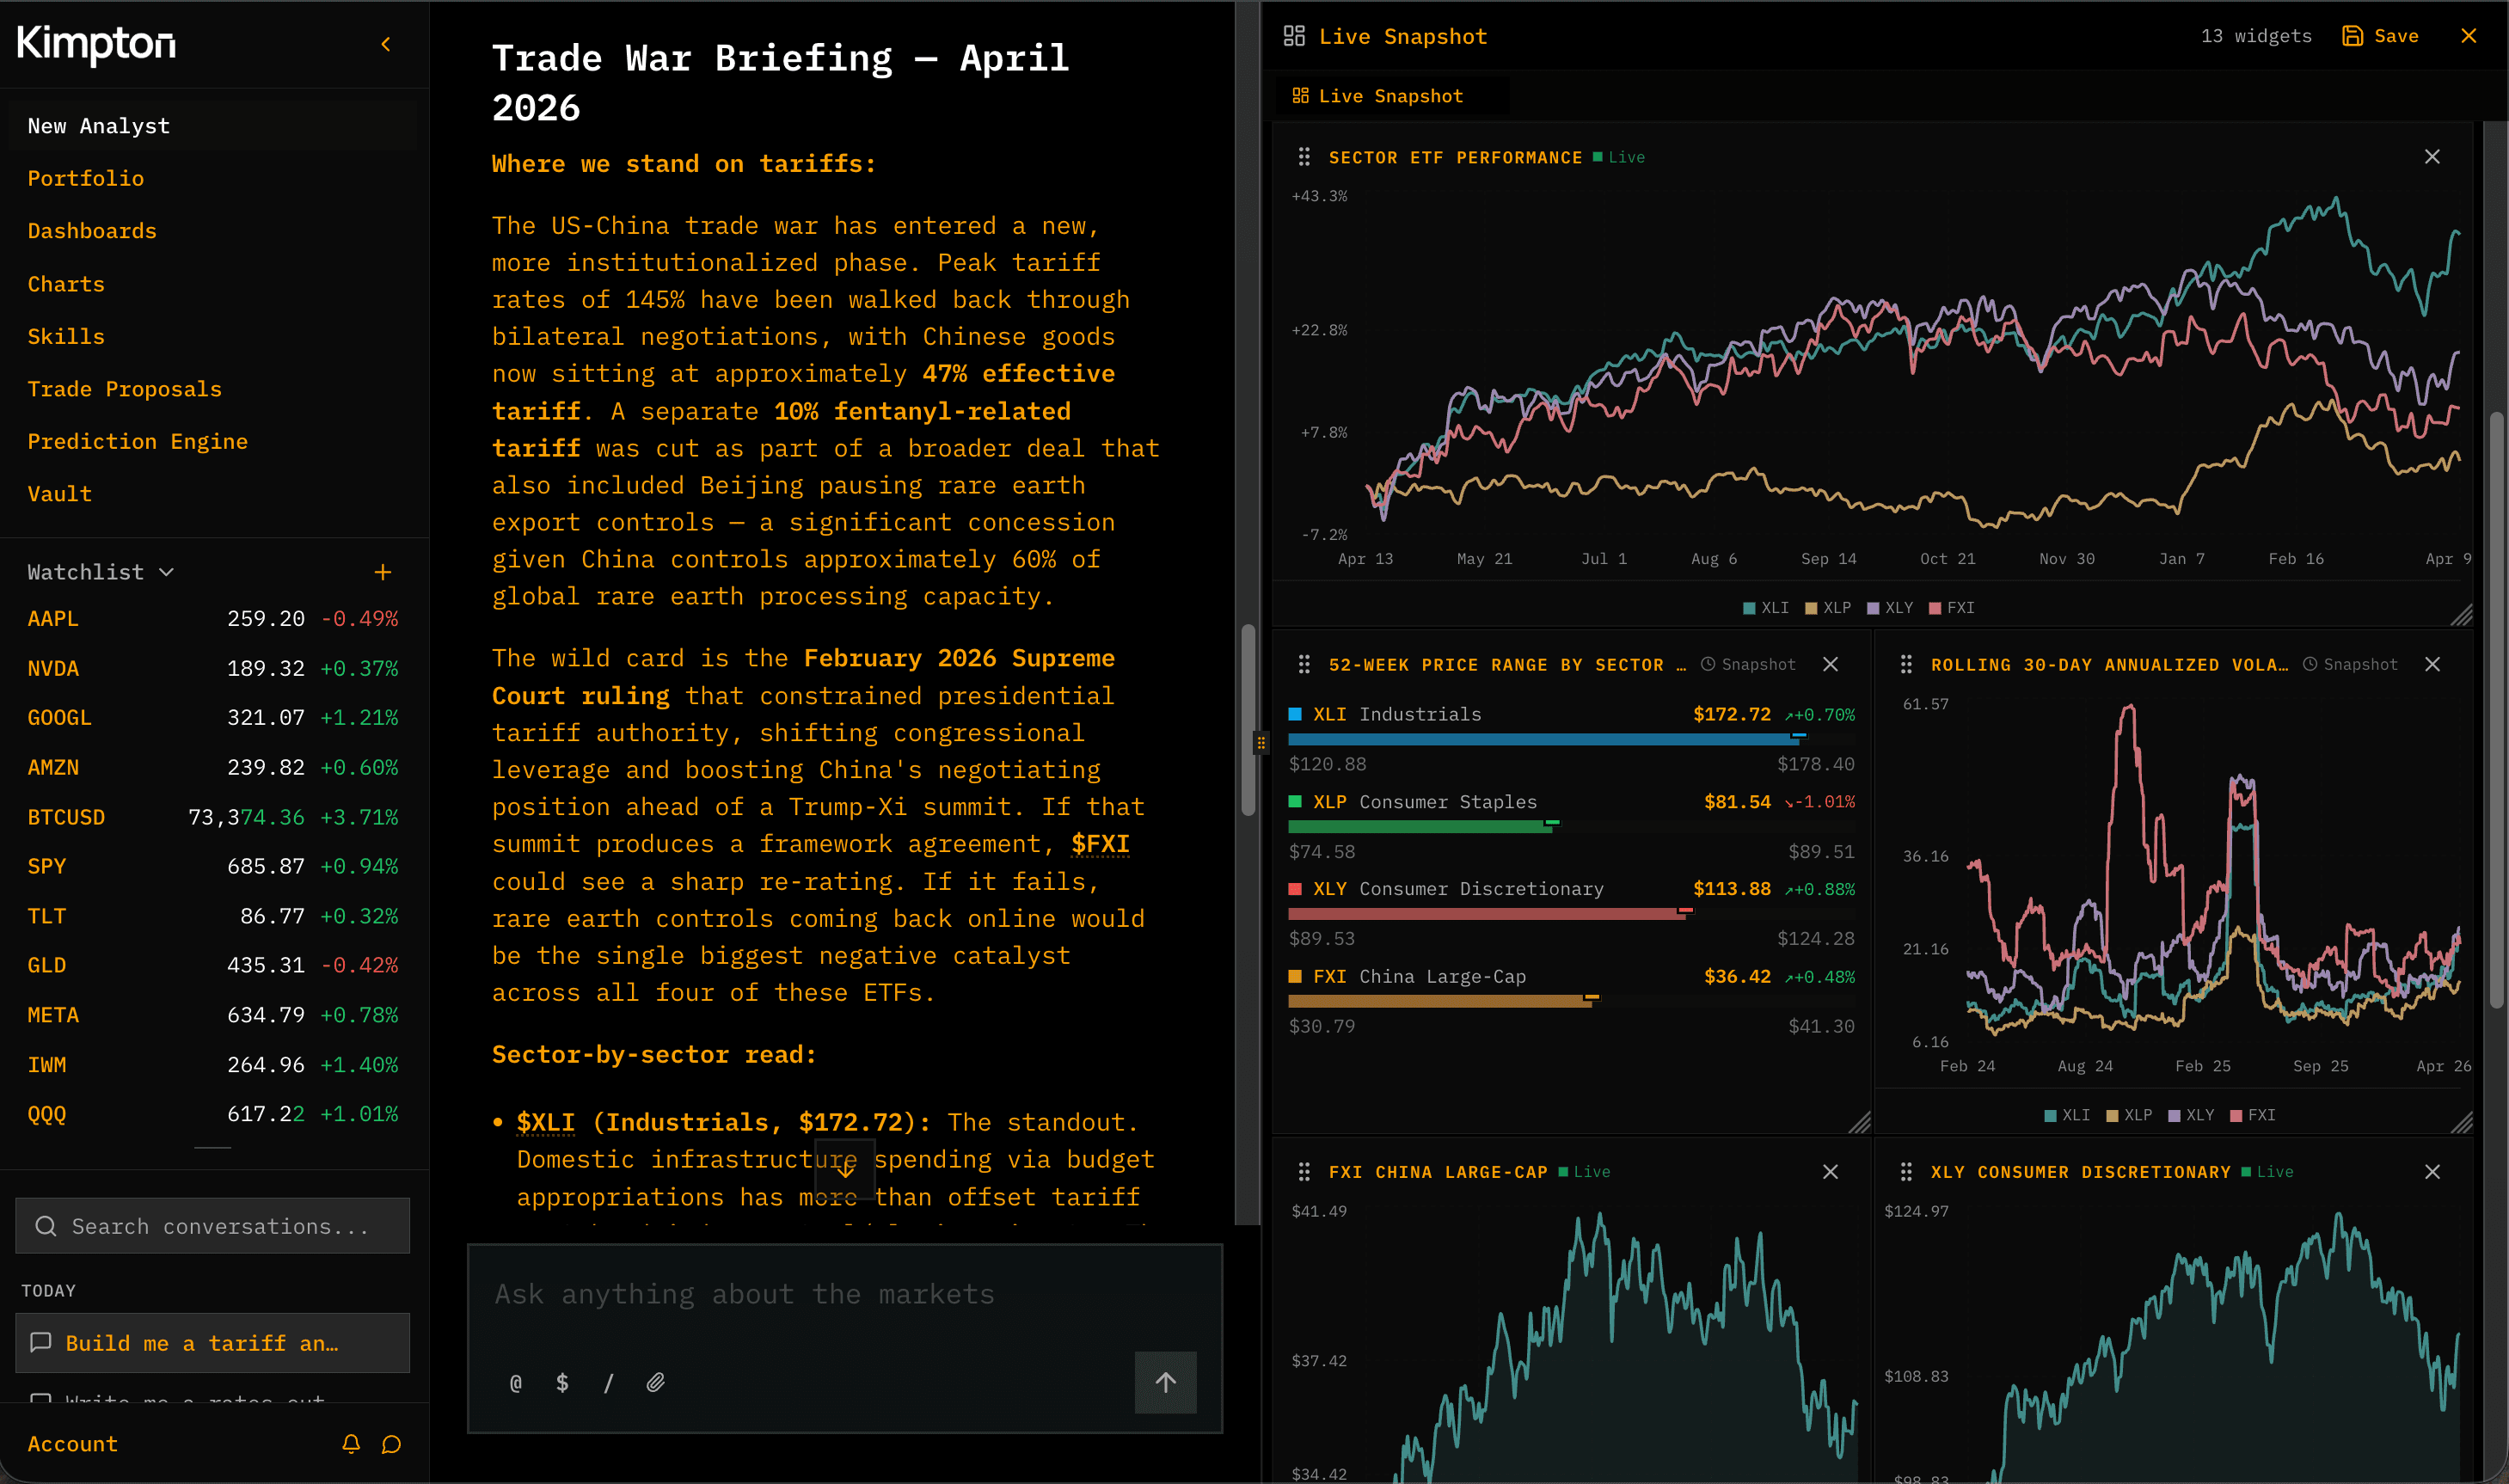
This update brings two major workflows together: AI-generated dashboards and trade proposals. Kimpton can now help create a live research surface, then connect that surface to the decision-making workflow that follows.
What's New
- Interactive dashboard grid with drag, resize, edit, and save behavior
- Dashboard agent that can add, update, and remove widgets
- Templates for market, macro, sector, crypto, and portfolio dashboards
- Live widgets for charts, metrics, holdings, tables, news, and AI-generated analysis
- Custom watchlists with row reordering
- Monte Carlo and computed chart widgets
- Trade proposal workflows with portfolio snapshots and P&L tracking
Why This Matters
Most dashboards are either static templates or manual BI projects. Most trade proposals are disconnected documents. Kimpton connects the two. You can ask for the dashboard you need, keep it live, and use it as the basis for a proposal.
The goal is to turn research from a conversation into an operating surface: something you can monitor, revise, share, and act on.
AI Dashboards
Dashboards now live in a dedicated grid system with typed widgets and persistent layouts. Start from a template or describe what you want in natural language. Kimpton builds the dashboard, places widgets intelligently, and keeps the result editable.
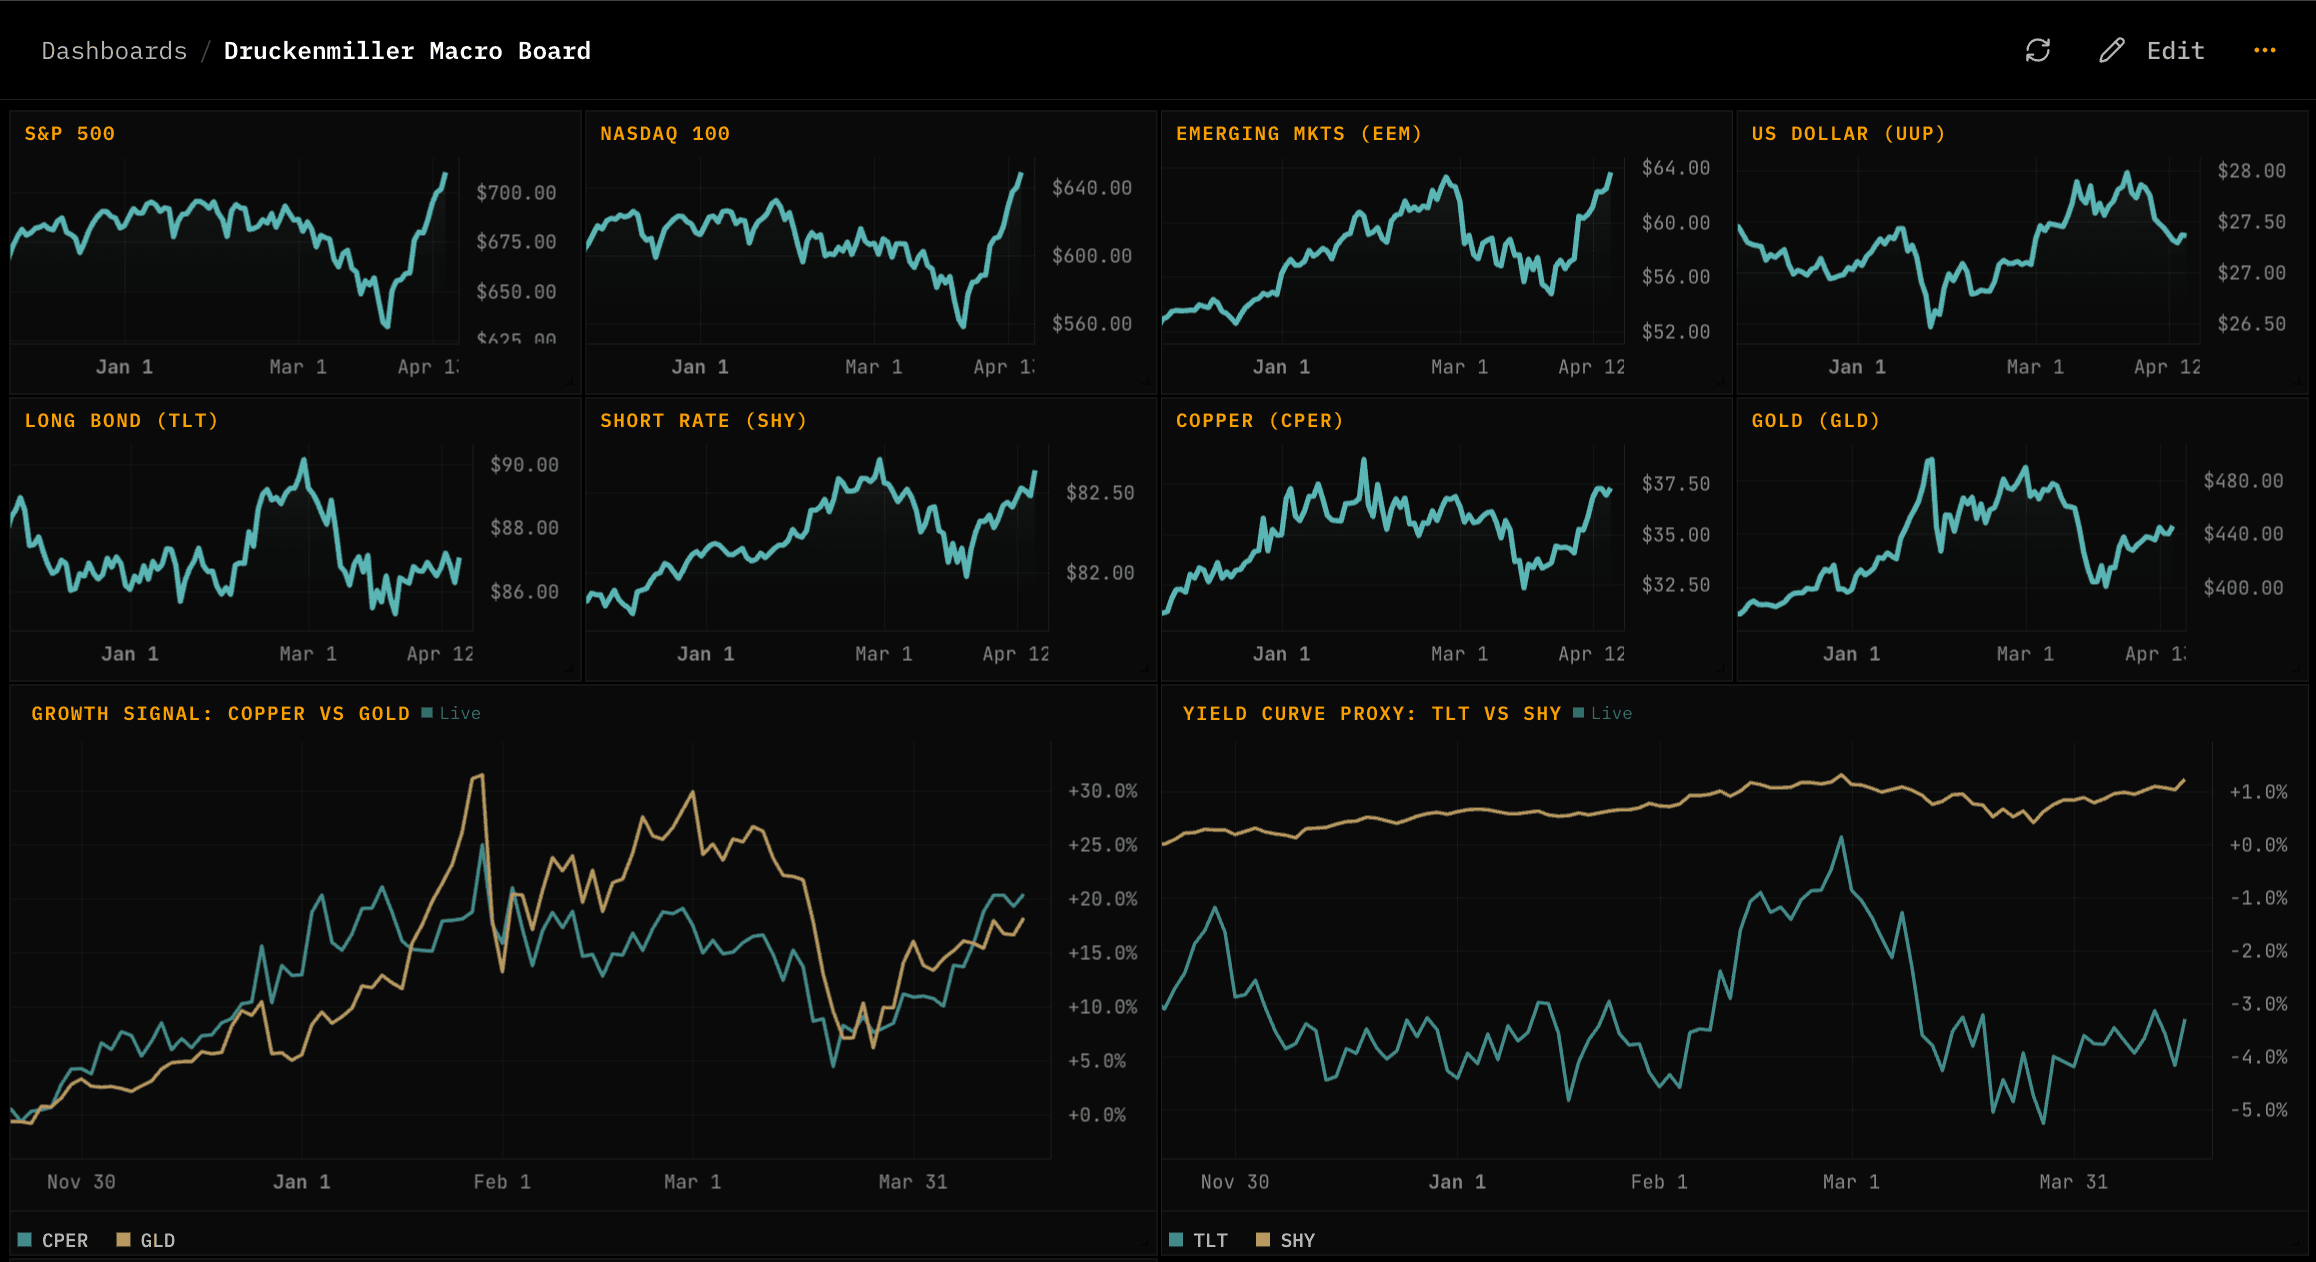
- Line, bar, pie, metric, table, holdings, news, and AI chart widgets
- Drag-and-drop layout editing
- Widget settings for display and data-source controls
- Template picker and dashboard list page
- Natural-language creation from the dashboard agent
Try asking
- “Build me a dashboard for AI infrastructure stocks”
- “Track my portfolio exposure to semiconductors and rates”
- “Create a macro dashboard with yields, dollar, gold, oil, and equity indices”
- “Add a custom watchlist for $AAPL, $MSFT, $NVDA, and $AVGO”
Trade Proposals
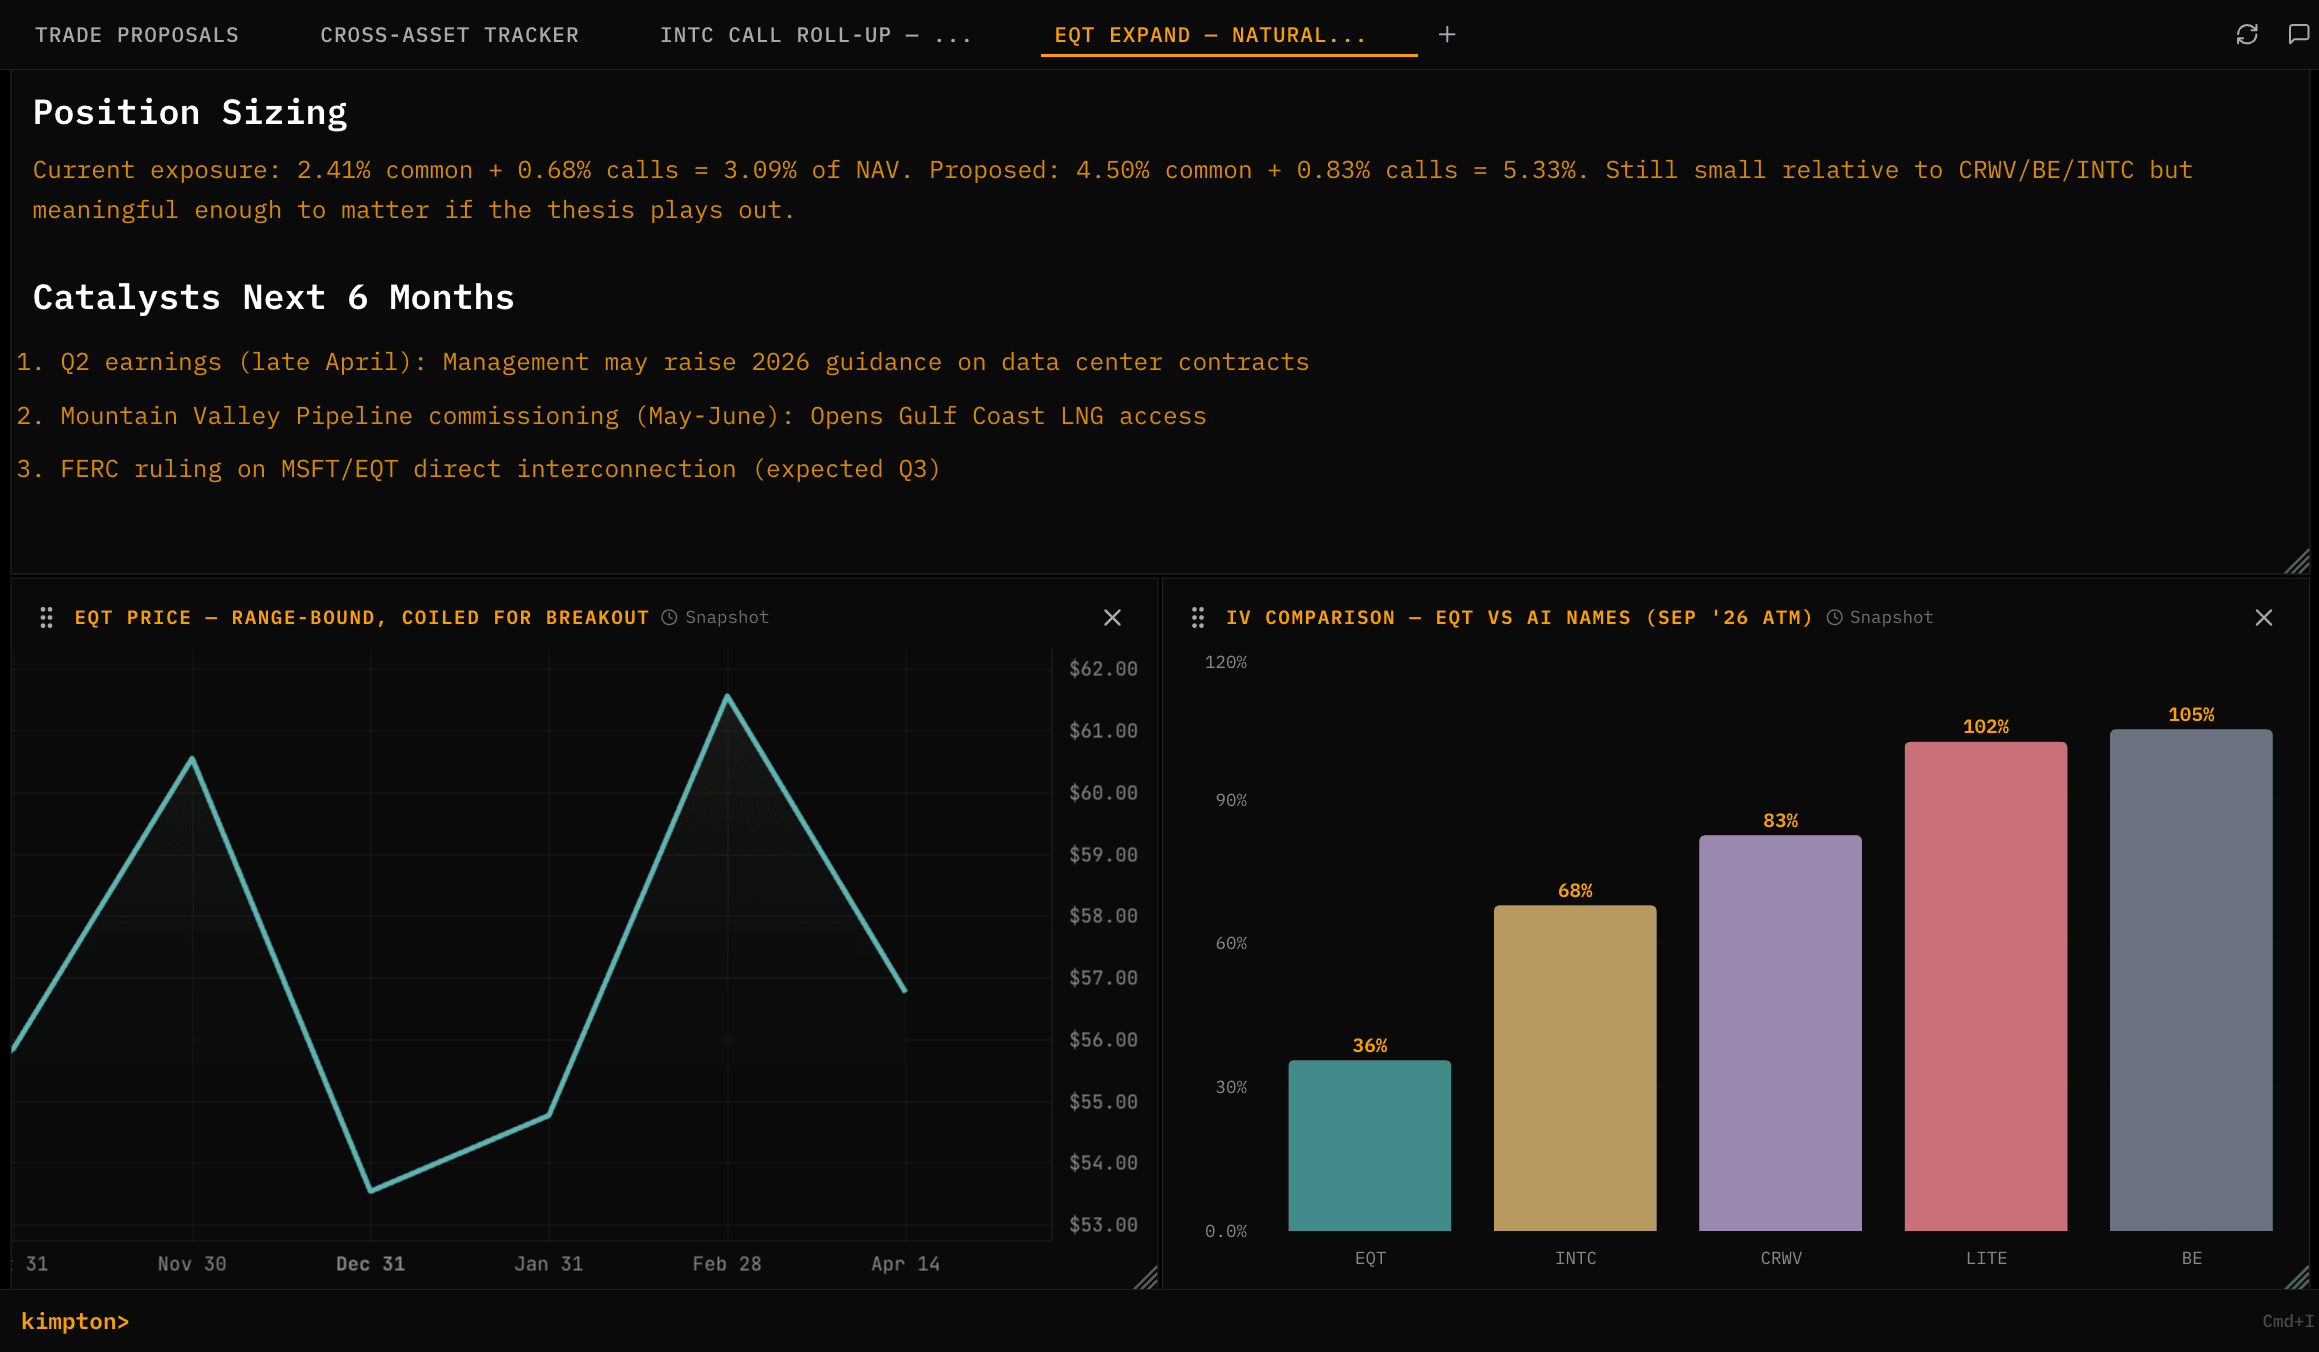
Trade proposals now sit closer to the portfolio and dashboard workflows. Kimpton can use portfolio snapshots, supporting research, and chart evidence to help frame the case for a potential trade.
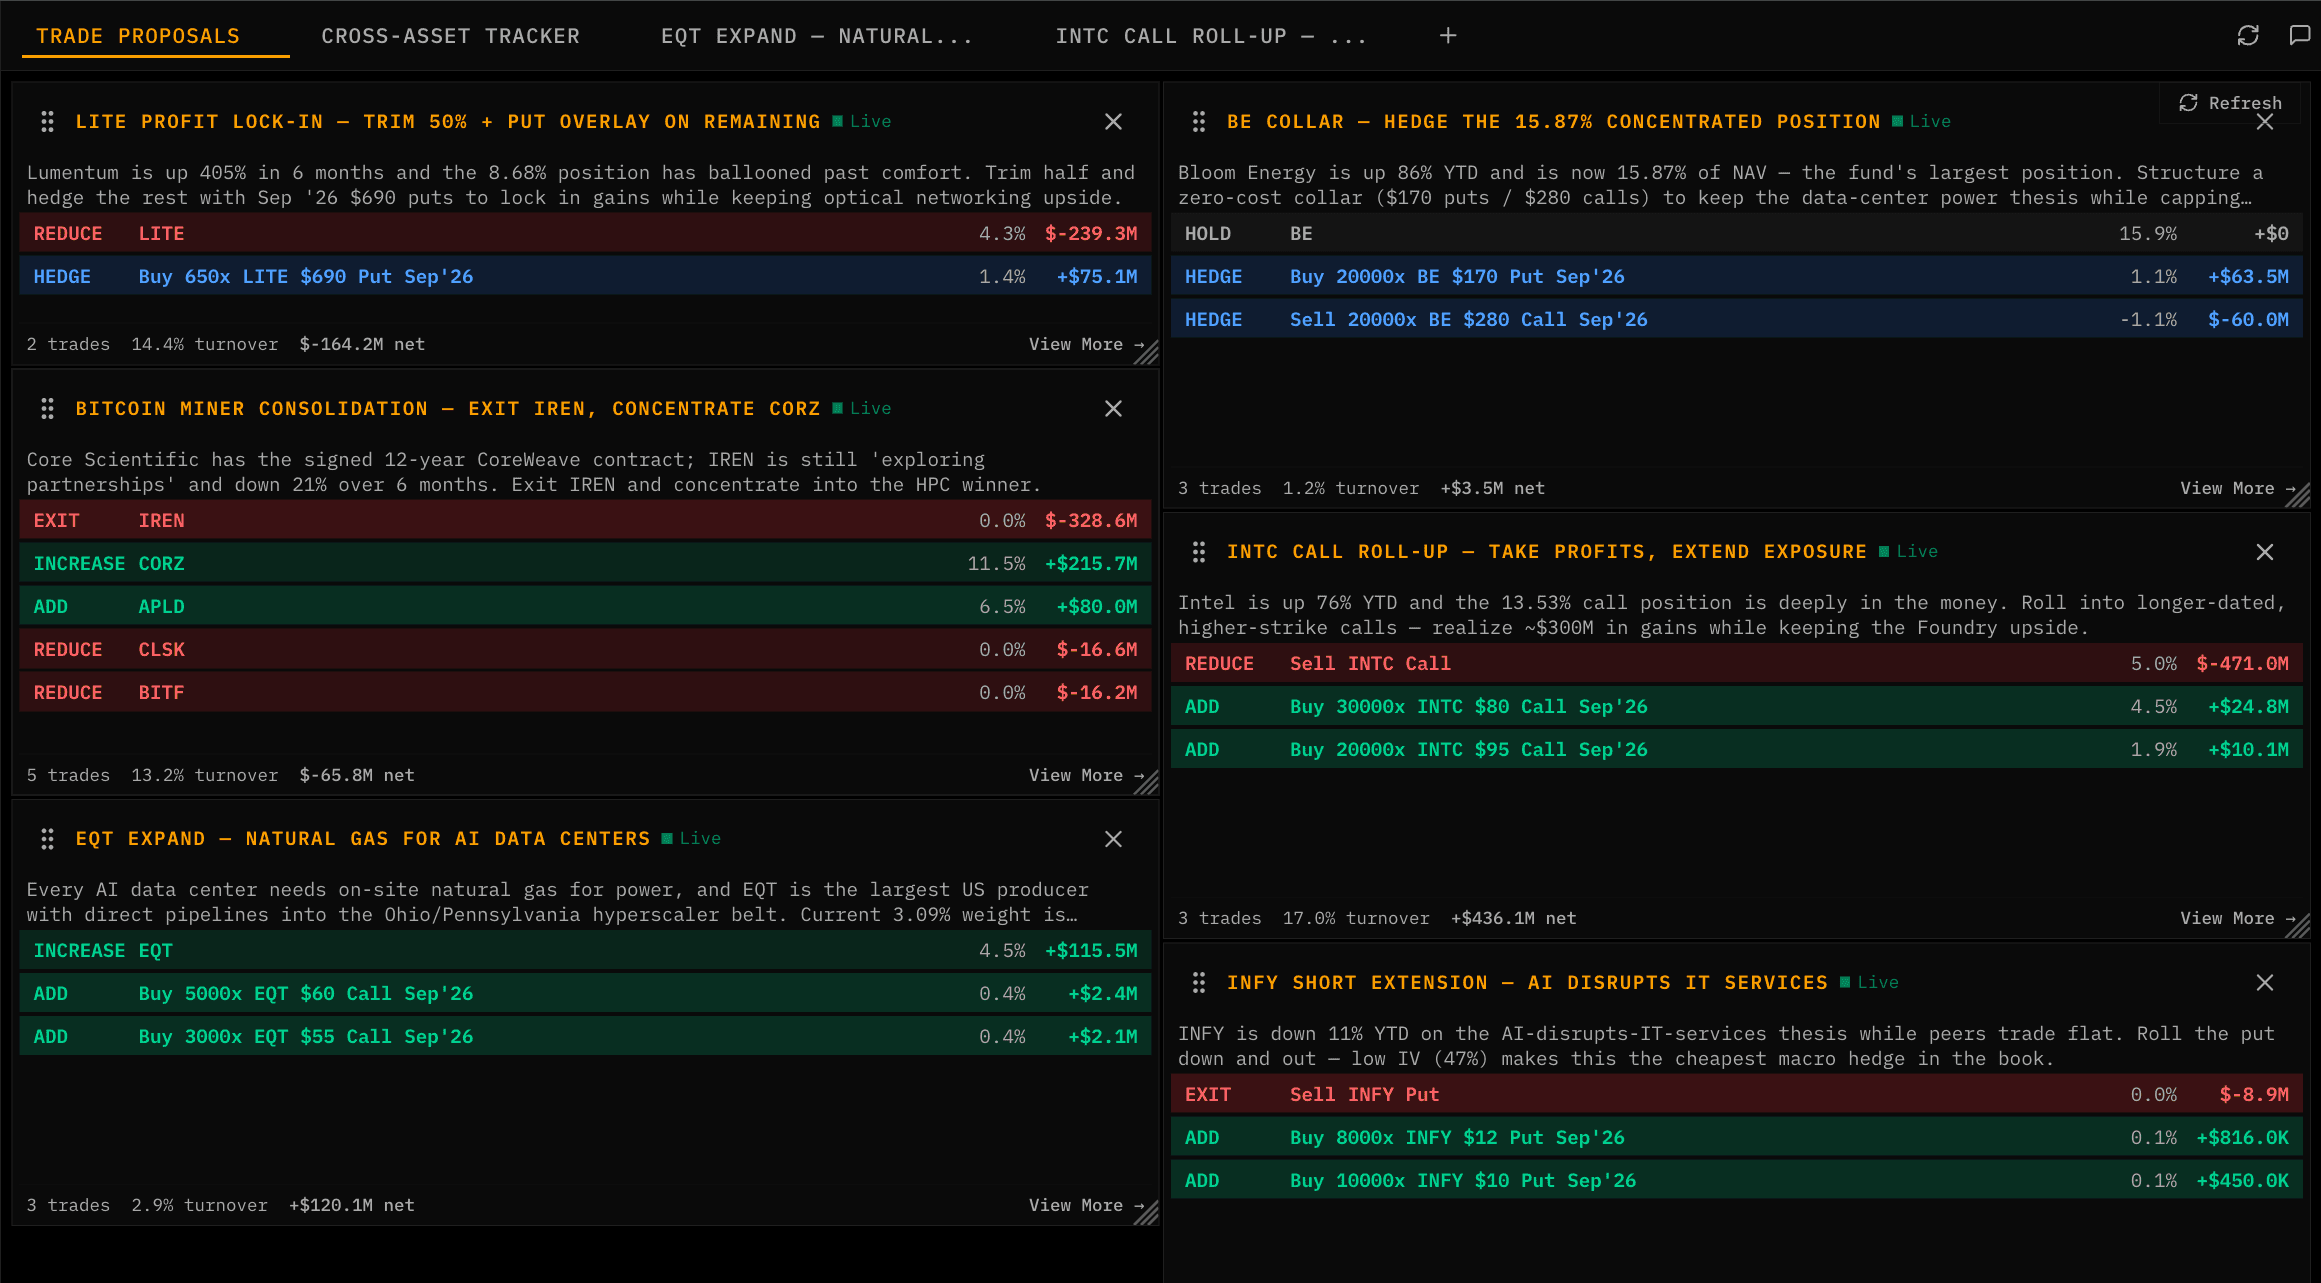
- Portfolio snapshot context
- Original portfolio UI for proposal review
- P&L tracking with market-hours-aware updates
- Per-position lifecycle handling
- Repair and sync tooling for proposal data
Computed Charts
Dashboards can also hold outputs that Kimpton computes, including Monte Carlo simulations and agent-generated chart widgets. This makes dashboards useful for forward-looking analysis, not just passive monitoring.
Try the latest update
Ask Kimpton to build a dashboard around a thesis, then turn the highest-conviction insight into a trade proposal.
Join our newsletter to get early access to new Kimpton AI features and updates.