

Investment research rarely stops at equities. Understanding how oil prices affect energy stocks, how gold moves with inflation expectations, or how agricultural commodities signal supply chain stress requires data that most platforms treat as an afterthought.
This update brings futures and commodities data into Kimpton, connecting macro signals to your existing research workflow. Combined with new chart types and a fullscreen editor that lets you refine visualizations through conversation, you can now explore relationships across asset classes without switching tools.
What's New
- Futures and commodities data across energy, metals, agriculture, and financials
- New chart types: bar charts, pie charts, scatter plots, and candlesticks
- Fullscreen chart editor with conversational modifications
Why This Matters
Macro context shapes every investment decision. When crude oil spikes, energy stocks follow. When Treasury futures signal rate expectations, the entire market reprices. These connections are fundamental, but most research tools make them hard to explore. Now you can ask Kimpton about futures the same way you ask about stocks, bringing commodities into your existing workflow.
Charts are where insight becomes clear. But static visualizations rarely show exactly what you need on the first try. The axes are wrong, the timeframe is off, or you want to see the data a different way. With the new chart editor, you can refine any visualization through conversation. Click a chart, ask for changes, and iterate until it shows exactly what you need. No more starting over.
New Features
Futures and Commodities Data
Kimpton now includes continuous futures series for commodities, currencies, and index contracts. This expands coverage for macro analysis and forecasting, letting you integrate futures data into any research question.
Equity Index Futures
| Symbol | Name | Exchange | Contract Months |
|---|---|---|---|
| ES | E-mini S&P 500 | CME | HMUZ |
| NQ | E-mini NASDAQ-100 | CME | HMUZ |
| YM | E-mini Dow ($5) | CBOT | HMUZ |
| RTY | E-mini Russell 2000 | CME | HMUZ |
| MES | Micro E-mini S&P 500 | CME | HMUZ |
| MNQ | Micro E-mini NASDAQ-100 | CME | HMUZ |
| MYM | Micro E-mini Dow | CBOT | HMUZ |
| M2K | Micro E-mini Russell 2000 | CME | HMUZ |
| EMD | E-mini S&P MidCap 400 | CME | HMUZ |
| NIY | Nikkei 225 (Yen) | CME | HMUZ |
| NKD | Nikkei 225 (USD) | CME | HMUZ |
Interest Rate Futures
| Symbol | Name | Exchange | Contract Months |
|---|---|---|---|
| ZB | 30-Year T-Bond | CBOT | HMUZ |
| ZN | 10-Year T-Note | CBOT | HMUZ |
| ZF | 5-Year T-Note | CBOT | HMUZ |
| ZT | 2-Year T-Note | CBOT | HMUZ |
| UB | Ultra T-Bond | CBOT | HMUZ |
| TN | Ultra 10-Year T-Note | CBOT | HMUZ |
| ZQ | 30-Day Fed Funds | CBOT | FGHJKMNQUVXZ |
| SR3 | 3-Month SOFR | CME | HMUZ |
Energy Futures
| Symbol | Name | Exchange | Contract Months |
|---|---|---|---|
| CL | WTI Crude Oil | NYMEX | FGHJKMNQUVXZ |
| NG | Natural Gas | NYMEX | FGHJKMNQUVXZ |
| RB | RBOB Gasoline | NYMEX | FGHJKMNQUVXZ |
| HO | Heating Oil | NYMEX | FGHJKMNQUVXZ |
| BZ | Brent Crude | NYMEX | FGHJKMNQUVXZ |
| MCL | Micro WTI Crude | NYMEX | FGHJKMNQUVXZ |
| MNG | Micro Natural Gas | NYMEX | FGHJKMNQUVXZ |
| QM | E-mini Crude Oil | NYMEX | FGHJKMNQUVXZ |
| QG | E-mini Natural Gas | NYMEX | FGHJKMNQUVXZ |
Metals Futures
| Symbol | Name | Exchange | Contract Months |
|---|---|---|---|
| GC | Gold | COMEX | GJMQVZ |
| SI | Silver | COMEX | HKNUZ |
| HG | Copper | COMEX | HKNUZ |
| PL | Platinum | NYMEX | FJNV |
| PA | Palladium | NYMEX | HMUZ |
| MGC | Micro Gold | COMEX | GJMQVZ |
| SIL | Micro Silver | COMEX | HKNUZ |
Agricultural Futures
| Symbol | Name | Exchange | Contract Months |
|---|---|---|---|
| ZC | Corn | CBOT | HKNUZ |
| ZS | Soybeans | CBOT | FHKNQUX |
| ZW | Wheat | CBOT | HKNUZ |
| ZM | Soybean Meal | CBOT | FHKNQUVZ |
| ZL | Soybean Oil | CBOT | FHKNQUVZ |
| ZO | Oats | CBOT | HKNUZ |
| KE | KC Wheat | CBOT | HKNUZ |
Livestock Futures
| Symbol | Name | Exchange | Contract Months |
|---|---|---|---|
| LE | Live Cattle | CME | GJMQVZ |
| HE | Lean Hogs | CME | GJKMNQVZ |
| GF | Feeder Cattle | CME | FHJKQUVX |
Currency Futures
| Symbol | Name | Exchange | Contract Months |
|---|---|---|---|
| 6E | Euro FX | CME | HMUZ |
| 6J | Japanese Yen | CME | HMUZ |
| 6B | British Pound | CME | HMUZ |
| 6A | Australian Dollar | CME | HMUZ |
| 6C | Canadian Dollar | CME | HMUZ |
| 6S | Swiss Franc | CME | HMUZ |
| 6N | New Zealand Dollar | CME | HMUZ |
| 6M | Mexican Peso | CME | HMUZ |
| E7 | E-mini Euro FX | CME | HMUZ |
| J7 | E-mini Japanese Yen | CME | HMUZ |
Crypto Futures
| Symbol | Name | Exchange | Contract Months |
|---|---|---|---|
| BTC | Bitcoin | CME | FGHJKMNQUVXZ |
| MBT | Micro Bitcoin | CME | FGHJKMNQUVXZ |
| ETH | Ether | CME | FGHJKMNQUVXZ |
| MET | Micro Ether | CME | FGHJKMNQUVXZ |
Volatility Futures
| Symbol | Name | Exchange | Contract Months |
|---|---|---|---|
| VX | VIX Futures | CBOE | FGHJKMNQUVXZ |
Futures data works everywhere in Kimpton. Use it in Deep Research to analyze macro trends. Chart it against your portfolio holdings. Include it in Market Insights analysis. Ask about correlations, historical patterns, or forward curves. The same natural language interface applies.
This is just the foundation. We are rapidly expanding coverage and will continue adding new products, asset classes, and data sources to give you the most comprehensive research platform available.
Try asking
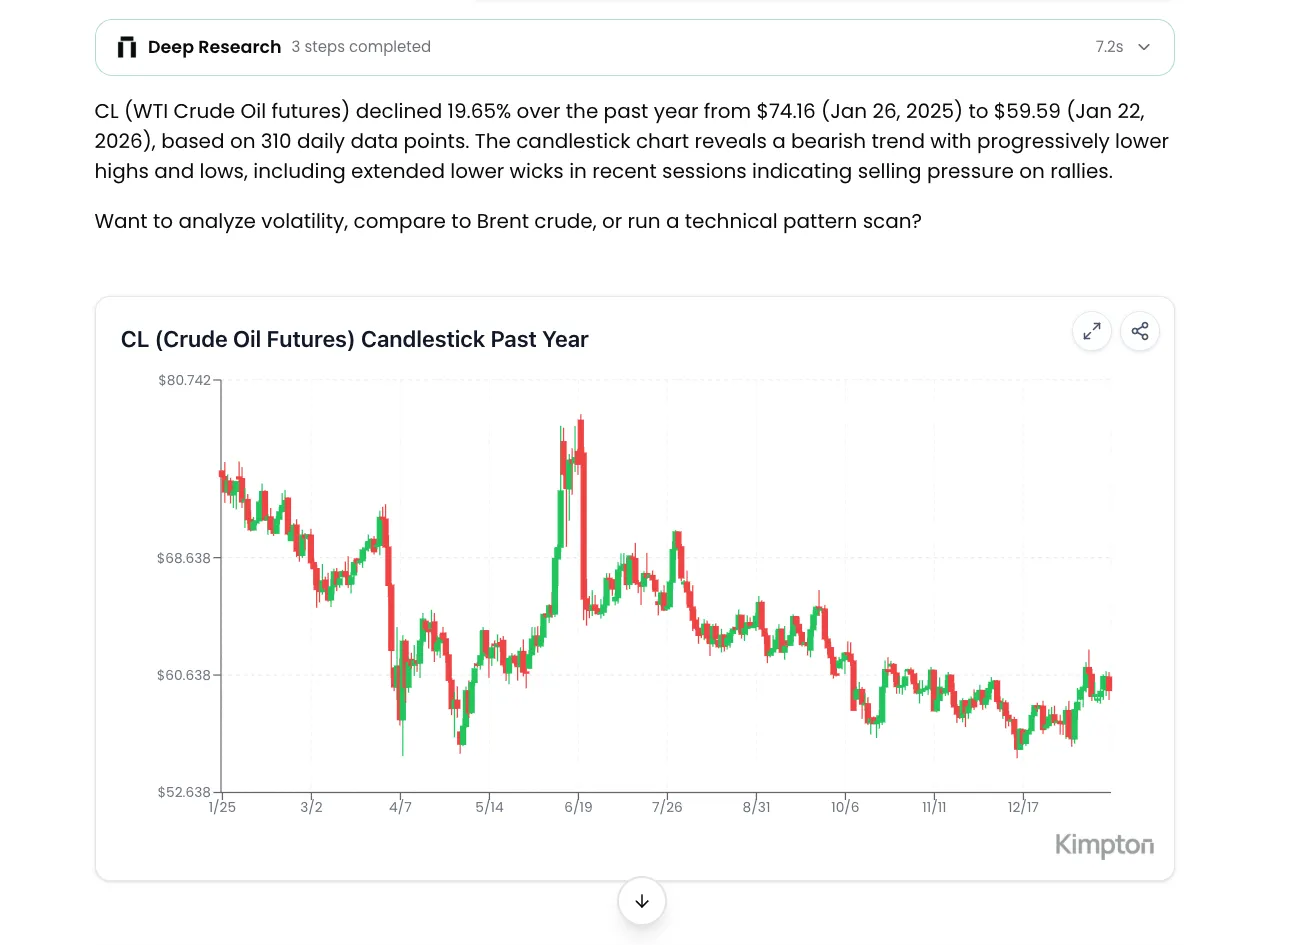
- “How has crude oil moved relative to XLE over the past year?”
- “What is the correlation between gold futures and TLT?”
- “Compare natural gas to utility stocks during the last winter”
- “How do agricultural futures correlate with inflation expectations?”
New Chart Types
Four new chart types give you more ways to visualize data. Kimpton selects the right format automatically based on your question, or you can request a specific type.
- Bar charts for comparing values across categories or time periods
- Pie charts for composition and allocation breakdowns
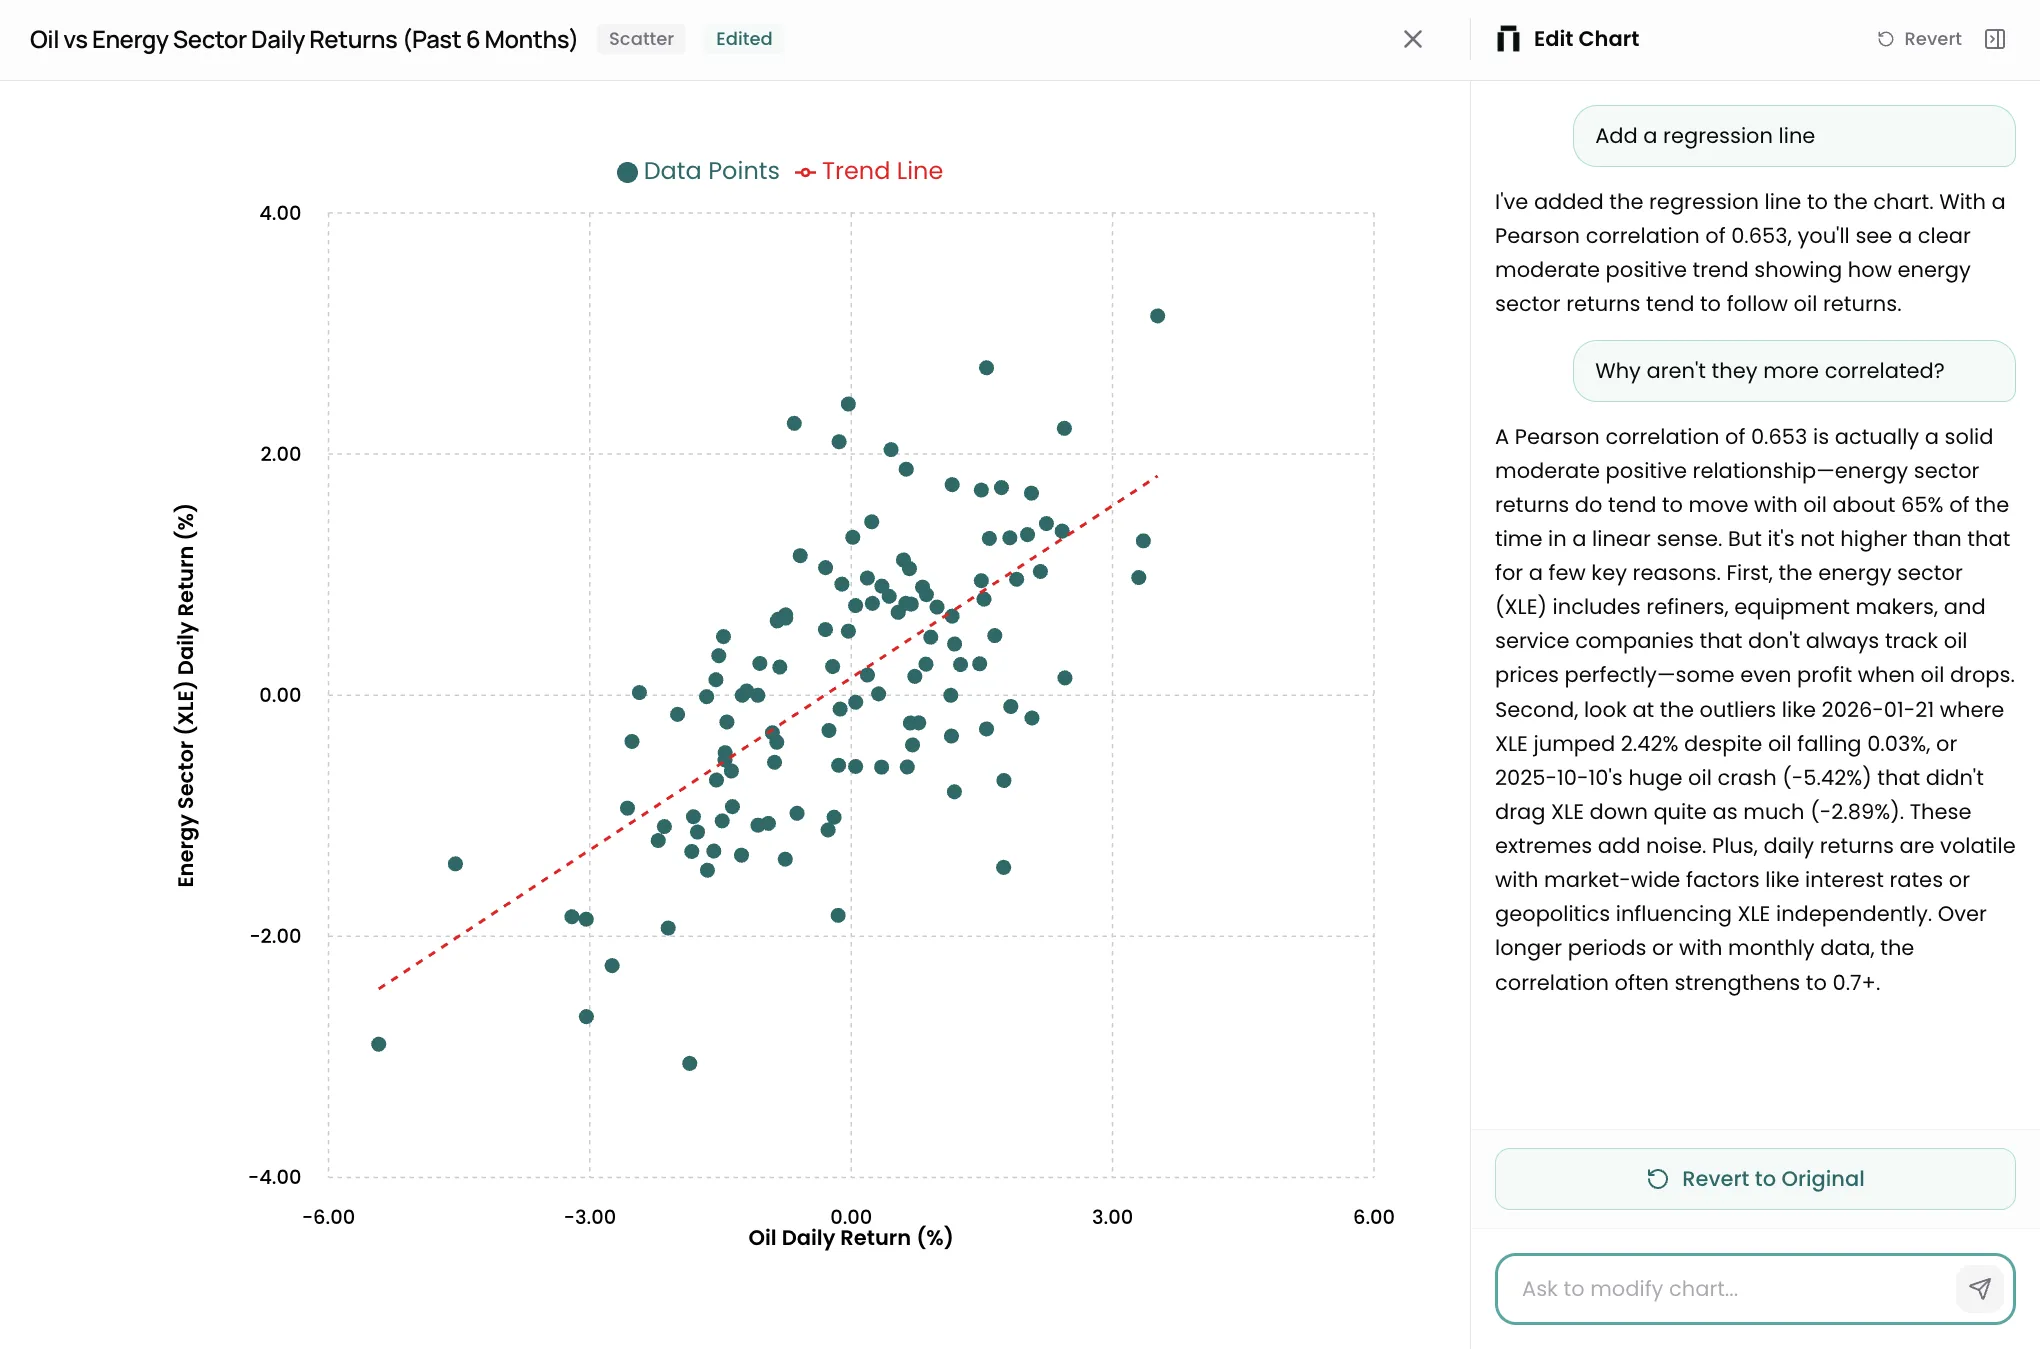
- Scatter plots with trend lines for correlation analysis
- Candlestick charts for price action and trading patterns
These chart types integrate with futures data and everything else in Kimpton. Visualize your portfolio allocation as a pie chart. Plot the correlation between gold and real yields as a scatter. Show crude oil price action as candlesticks.
Fullscreen Chart Editor
Click any chart to expand it fullscreen, then ask Kimpton to modify it. Change colors, adjust axes, add trend lines, or transform the visualization entirely. Kimpton remembers your conversation and applies each edit to the same chart.
- Expand any chart to fullscreen with one click
- Modify through natural language: colors, labels, axes, annotations
- Conversation memory preserves context across edits
- Works with all chart types including futures data
Try saying
- “Add a trend line to the crude oil series”
- “Change the gold line to yellow”
- “Only show the last 6 months”
- “Switch to a logarithmic scale”
Try the latest update
Ask about oil, gold, or any commodity and see how it connects to your research. More asset classes and data sources are coming as we continue expanding the most comprehensive research platform for investors.
Join our newsletter to get early access to new Kimpton AI features and updates.